
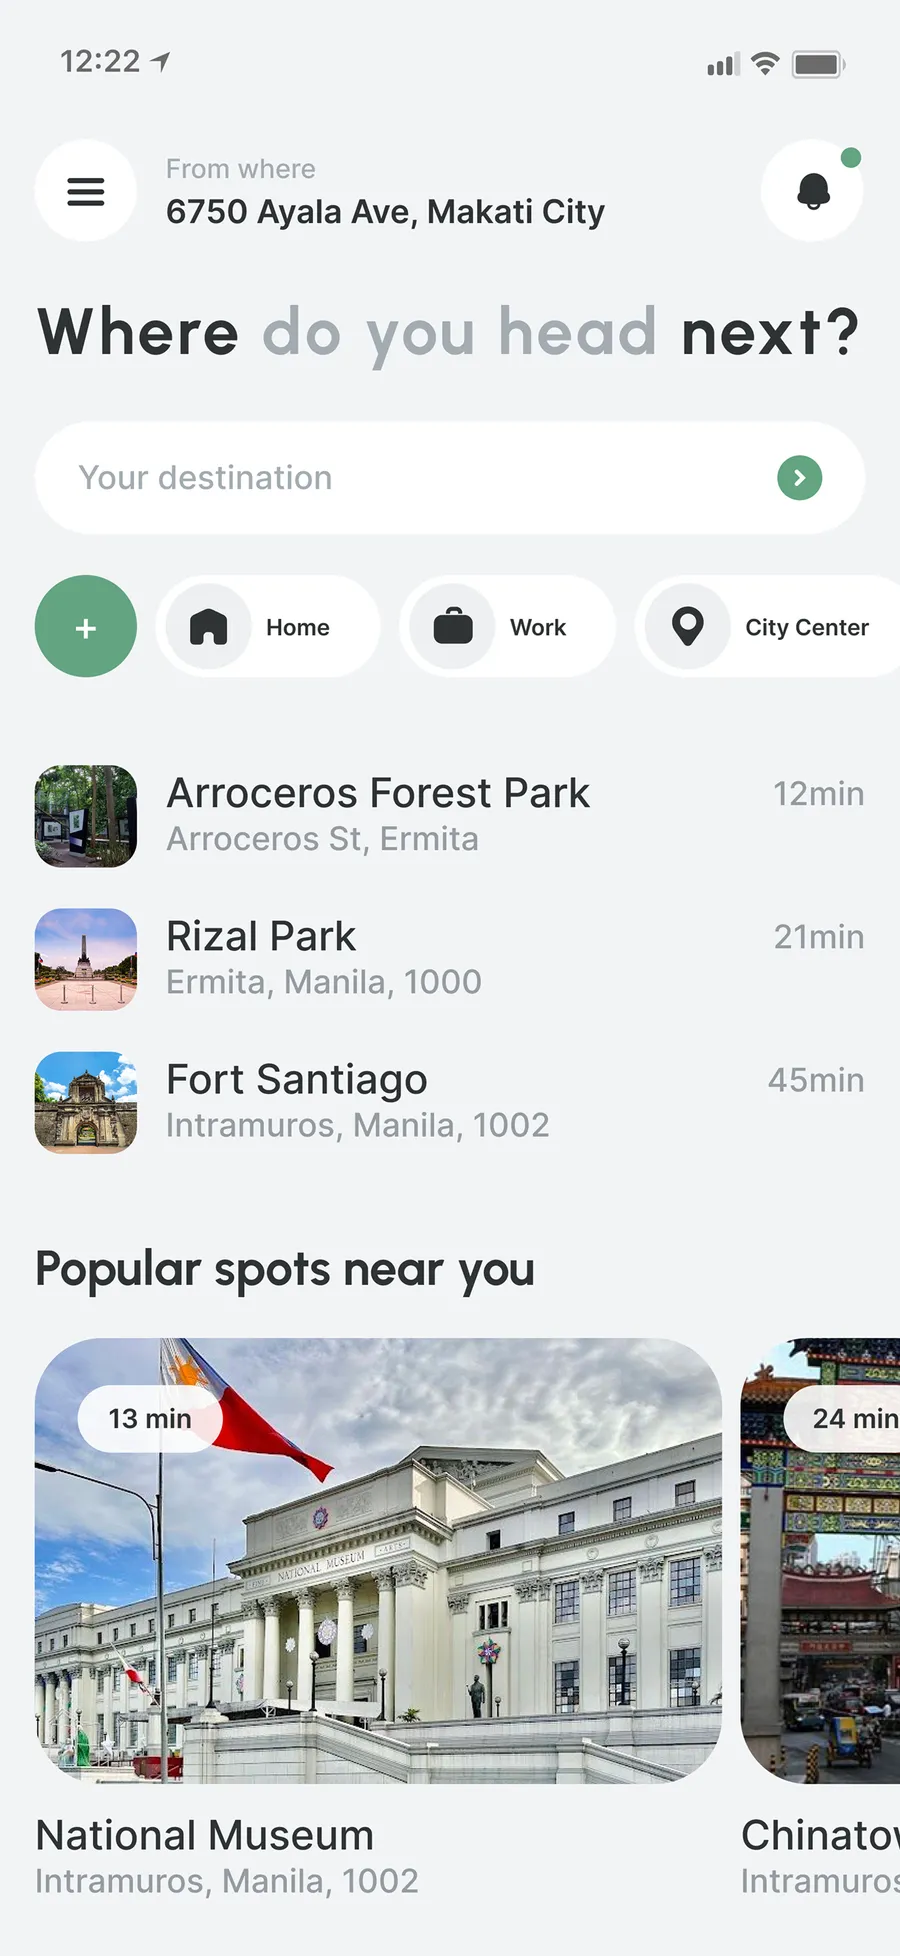
Tara
Making Manila's public transport legible enough to trust
I spent a month in Manila and never once took a jeepney. Not because I didn't want to - because I couldn't figure out how. The routes, the stops, the fares - none of it made sense to me. So I took taxis every day, spent way more than I planned, and left feeling like I'd missed the city I actually came to see. When I got home, that frustration turned into a question: what would it take to make someone feel confident enough to just try? That's what I designed. Not a better maps app. Just enough information to close the gap between watching and actually participating.
Overview
Tara is a concept mobile app for navigating Manila's public transport with more confidence. It focuses on reducing uncertainty across route planning, transfers, fares, and cash-based travel by translating local transport logic into a clearer user experience.
Team
Solo concept project led independently from research framing through testing and visual design.
My role
End-to-end UX process: research framing, market analysis, field observation, information architecture, wireframing, UI design, and usability testing.
The problem
Hypothesis
Constraints
1. The first reality check came quickly: jeepneys had no reliable GPS feed, no fixed stops, and no structured public data, so the obvious idea of true live tracking fell apart almost immediately.
2. No centralized API connected Manila's transport modes, and the moments when users most needed guidance, such as underground or in weak-signal areas, were exactly the moments when a live-only product would fail.
3. Even when some data existed, the city itself resisted false precision. Traffic shifted too quickly for exact ETAs to be trustworthy, and because jeepneys were still cash-only, the product could not honestly promise one seamless payment system across every mode.
Initial Thoughts
Before any research, I started with the frustration itself. The jeepney system is not broken - it moves millions of people every day at a fraction of the cost of ride-hailing. But for anyone who did not grow up with it, the system is completely opaque.
Routes are painted on windshields in shorthand locals read instantly. Stops are not marked. Fares are not posted. The entire system runs on insider knowledge that no app had ever tried to translate.
My initial hypothesis was simple: the problem is not the transport system - it is the legibility gap. Tourists and new residents default to Grab not because jeepneys are worse, but because the system feels unreadable and unpredictable. Fixing that did not require new buses or better roads. It required better information flow.
Research
Market research
Manila's public transport market is large and growing. The Philippines bus market was valued at USD 240 million in 2024 and is projected to reach USD 358 million by 2033. Metro Manila alone runs approximately 55,000 jeepneys, 5,000 buses, and nearly 17,000 taxis across the city. Demand is not the problem. Availability is not either, at least not on paper.
Transport availability
Jeepneys in Metro Manila
55,000
Buses in Metro Manila
5,000
Taxis in Metro Manila
17,000
For the drivers still operating, the economics are brutal. Earnings that once reached PHP 1,250 a day have fallen to around PHP 200-300 under fuel price pressure, a fraction of the PHP 1,800 daily boundary the government's own service contracting program considers viable net pay. For passengers, the cost gap is equally stark: a jeepney ride costs PHP 30-100, a bus PHP 20-70, while Grab can cost PHP 200-600 for the same journey.
The opportunity is not to build something new on top of a broken system. It is to close the gap between a system that works for people who understand it and the growing number of people who do not.
Affordability gap
Even though public transport is more affordable, tourists still prefer taxis.
Jeepney
PHP 50
Bus
PHP 35
Taxi
PHP 300
Market growth
Bus market value keeps growing
The wider transport market is still expanding, even while rider trust stays fragile.
2024
USD 240M
2033
USD 358M
Fleet decline
Jeepney supply shrank sharply
The system still moves millions, but the fleet available to support that demand is much smaller.
2013 fleet
193,000
2023 fleet
95,000
Pre-pandemic
300,000
2023 national
180,000
Cost gap
Public transport remains far cheaper than Grab
Affordability is not the problem. Confidence and legibility are.
Bus ride
PHP 20-70
Jeepney ride
PHP 30-100
Grab ride
PHP 200-600
Driver earnings also fell from about PHP 1,250 a day to PHP 200-300 under fuel pressure.
User Interviews
I conducted interviews and ride-planning walkthroughs with four participants: a local office worker, a first-time tourist from Germany, a university student, and a working professional who regularly defaulted to Grab.
The sessions focused on how they planned trips, what information they trusted, and what they did when a route became uncertain or stressful.
The result was clear: the biggest problem was not transport availability, but fragmented and unreliable information. Participants depended on 2 to 4 different tools, could not trust ETAs or stop guidance, and often switched to Grab the moment uncertainty felt too risky.
Safety also shaped decisions more than price. Participants made route choices based on lighting, crowd behavior, and time of day, but none of the existing tools surfaced any of that context in a structured way.
Local office worker
Daily commuter
I leave much earlier than I should because if one part of the trip goes wrong, the whole commute falls apart.
“
First-time tourist
Visitor from Germany
I wanted to use jeepneys, but I never knew where to stand, when to get off, or whether I was even on the right route.
“
University student
Regular public transport user
When delays happen, I end up checking several apps and group chats at once because no single place tells me what is happening.
“
Working professional
Grab fallback user
Public transport is cheaper, but when I cannot trust the timing or stop information, I switch to Grab just to feel certain.
“
Survey
What are the daily challenges participants face during Manila commutes?
1. How long does your daily commute usually take?
<30 min
2 (5%)
30-60 min
10 (25%)
60-90 min
12 (30%)
90-120 min
10 (25%)
>120 min
6 (15%)
2. What's your main way of getting around?
MRT/LRT
18 (45%)
Jeepney
10 (25%)
Bus
7 (18%)
Grab / Ride-hailing
4 (10%)
Private car / motorcycle
1 (2%)
3. What frustrates you the most during your commute?
Traffic jams
16 (40%)
Overcrowding
10 (25%)
Delays / breakdowns
7 (18%)
Complex transfers
4 (10%)
Weather / flooding
2 (5%)
High fare cost
1 (2%)
4. Which apps do you use to help plan your commute?
Google Maps
36 (90%)
Grab
20 (50%)
Waze
16 (40%)
LRT/MRT schedule apps
6 (15%)
None
2 (5%)
5. How often do these apps fail to give the info users need?
Never
1 (2%)
Rarely
4 (10%)
Sometimes
16 (40%)
Often
14 (35%)
Almost always
5 (13%)
6. What kind of problems have you faced when using these apps?
No offline access
12 (30%)
Reroutes into congestion
10 (25%)
Missing jeepney/bus schedule
10 (25%)
No crowd info
6 (15%)
Wrong ETA
2 (5%)
7. When you encounter traffic or delays, what do you usually do?
Leave earlier to avoid being late
18 (45%)
Take a different route
10 (25%)
Switch to a different transport
7 (18%)
Wait it out
4 (10%)
Cancel or postpone the trip
1 (2%)
8. When do you feel safe while commuting?
All the time
16 (40%)
Only during the day
10 (25%)
During rush hours / many people around
7 (18%)
During day and night in well-lit areas
4 (10%)
Only in familiar neighborhoods
2 (5%)
Never
1 (2%)
The core problem is not the transport system, it is the information gap. Despite having navigation apps, commuters cannot trust them because they lack critical real-time data: arrival times, crowd conditions, delay predictions, and offline access. This forces users into exhausting workarounds, leaving 30 to 45 minutes early, constantly switching between multiple apps, and checking social media for updates.
Users are making emotional, not rational, decisions. Even though cheaper public transport exists, stress about uncertainty drives them toward expensive Grab, where at least the wait time feels more predictable.
The opportunity is consolidation. Commuters do not need new infrastructure, they need one reliable place that holds all the information they currently scatter across 2 to 4 apps, allowing them to plan confidently and stop second-guessing their choices.
Observation Sessions
Watching commuters in real time revealed the workaround systems they had built to survive the information gap. One local office worker checked Google Maps, a Facebook commuter group, and asked a station guard before boarding a single train. A tourist screenshotted his route before leaving the hotel because he expected to lose signal mid-journey.
A student knew every stop on his route from memory but had no reliable way to share that knowledge beyond talking to someone in person. These were not minor inconveniences. They were full systems people had built to manage a trip that, with better information flow, should have taken only a few taps.
Competitor Analysis
Existing tools each solved one part of the problem while ignoring the rest. Sakay.ph handled jeepney routing better than anyone else but lacked live conditions and driver visibility. Google Maps offered global scale but treated jeepneys as data gaps. Grab won through predictability, but separated riders from public transport entirely and at a much higher cost.
The gap was not a missing feature. It was a missing layer: no app consolidated routing, real-time conditions, safety context, and fare clarity across all modes in one place.
| Google Maps | Waze | Grab | LRT/MRT schedules | |
|---|---|---|---|---|
| Multimodal integration (Train + Jeepney + Bus) | Partial; jeepneys unclear | Partial; jeepneys unclear | Car-only | Strong transit coverage |
| Live crowd density | Live crowd density | - | - | -, limited |
| Train arrival countdown | Train arrival countdown | Inconsistent | - | Partial |
| Flood-aware routing | Flood-aware routing | - | Hazard reports only | - |
| ETA confidence score | - | - | - | - |
| Delay probability | Ajust | Real-time car tracking | Real-time car tracking | + |
| Environmental-adjusted ETA | - | - | - | - |
| Route comparison (Time / Cost / Comfort / Safety) | Time only | Time only | Time / Cost / Comfort | - |
| Transfer simplicity indicator | + | + | + | + |
| Jeepney clarity (simplified visual) | - | - | - | - |
| Area safety score | - | - | - | - |
| Community alerts integrated in routing | Community alerts integrated in routing | Community alerts integrated in routing | Community alerts integrated in routing | Community alerts integrated in routing |
User Personas
I developed two personas that represented the most distinct user groups and the most different relationships with Manila's transport system.
Maria
Age: 34
New resident, moved to Manila 1 week ago
Occupation: accountant
Home location: Quezon City
Work location: Makati
About
Maria recently relocated from Cebu City to Metro Manila for a new job. She rents an apartment in Quezon City and commutes daily to her office in Makati. During her first week, she relied on taxis because she was unfamiliar with the city. However, the daily cost quickly added up, and unexpected rush-hour traffic made her late a few times, pushing her to look for more reliable and affordable ways to commute.
Quote
"I would love to start using local transport so I won't need to spend so much to get to my work and back every day, I tried to use jeepney one time, but I got lost and had to order a taxi and still was late for my work."
Goals
Find a reliable and comfortable route to her work and back she can use daily
Keep daily transport expenses manageable
Avoid being late to her work
Keep safe during her trips
Needs
Simple step-by-step navigation
Travel time prediction with accounting for time in traffic
Ability to compare ETA (estimated time of arrival), price and transport options and combinations
Pain points
Difficult to understand jeepney routes and stops
Traffic makes travel times unpredictable
Limited information about which route is most reliable
Fear of getting lost during transfers
Stefan
Age: 28
Tourist, staying in Manila for a month
Occupation: software engineer
Renting at: BGC
About
Stefan is a software engineer from the United States spending a month exploring the Philippines. He is staying in Bonifacio Global City in Manila and wants to experience the city beyond tourist spots by visiting local markets, museums, and cultural areas. He tried using traditional transport like jeepneys and buses but found the routes confusing and got lost a few times.
Quote
"I want to explore the city like a local, but I keep getting lost using jeepneys and buses, so I end up spending more on Grab than I planned."
Goals
Explore Manila extensively and experience authentic local life
Travel affordably without over-relying on ride-hailing apps
Avoid getting lost while navigating unfamiliar areas
Understand all transport options clearly
Needs
Clear explanation of jeepney, bus, and MRT/LRT routes
Reliable travel time predictions, including traffic and crowding
Step-by-step navigation for transfers and unfamiliar routes
Ability to compare routes based on time, cost, comfort, and safety
Safety indicators for areas he hasn't visited before
Pain points
Jeepney and bus routes are confusing
Travel times are unpredictable due to traffic and delays
Hard to know where to board or transfer
Limited visibility of crowding, safety, and reliability
Needs multiple apps or external sources to plan a single trip
Customer Journey Maps
Mapping Maria's journey from Quezon City to Makati revealed the exact moments where confidence collapsed. She could not see all available transport options in one place, could not confirm whether she was at the right jeepney stop, and eventually defaulted to Grab because uncertainty felt more expensive than money.
For Stefan, the critical failure was a single missed stop. No alert told him when to get off. He overshot his destination, had to walk back, lost signal, and switched to Grab. That one failed trip ended his willingness to try jeepneys for the rest of his stay.
The journey maps made two things clear: confidence does not require perfect data, and a single failure can permanently destroy trust.
The most striking contradiction was behavioral. In interviews, nearly everyone said they preferred jeepneys and buses and wanted to stop overspending on Grab. In reality, the moment any uncertainty appeared, they opened Grab.
Every commuter had already built a mental Plan B: if this gets confusing, I will just take a taxi. That fallback is always one tap away, and the moment any uncertainty appears, the fallback wins.
Maria
| Phase | Action | Thoughts/emotions | Pain points | Opportunities / Features |
|---|---|---|---|---|
| Planning | Checks Google Maps to see how to get from her home to work | "Okay, what is the fastest way to get to Makati?" Excited | Google Maps does not show all available route options. | Show all available routes and transport modes. |
| Leaves home with a 45-minute buffer | "I need to make sure I will not be late." Cautious | Uncertainty about how long it will take to get to the destination. | ETA prediction based on real traffic information. | |
| Sees only bus stops on the map, which are 30 minutes away on foot | "I do not have enough time to get there." Anxious | The app does not display stops for transport options other than buses. | Show nearby jeepney and bus pickup points within walking distance. | |
| Detour | Asks for help to find the closest stop that can take her to the destination | "Where can I get a ride from here?" Uncertain | She has to rely on other people instead of the product. | Show nearby jeepney and bus pickup points within walking distance. |
| Gets help from a local, who directs her to the closest jeepney stop | "Ah, here it is!" Relief | She needs outside help to continue the trip. | Make pickup points clear enough that users do not need to ask locals. | |
| Gets to the stop and waits for 15 minutes | "Is this even a right stop?" Doubtful | There is no way to confirm whether this is the correct transport stop. | Live vehicle tracking and stop confirmation. | |
| Thinks the jeepney is late and orders Grab | "I can not be late at my first day." Panicked | There is no arrival time information. | Wait time estimates. | |
| Jeepney arrives after 10 minutes, but the taxi has already arrived as well | "Now I paid for the fallback anyway." Annoyed | The lack of timing information pushes her into unnecessary fallback costs. | Wait time estimates and stronger confidence cues before switching. | |
| Arrival | Arrives at work late because of the traffic while she already lost time searching for a stop | "The trip failed before it even properly started." Disappointed | Route suggestions do not account for traffic patterns and pickup uncertainty. | Real-time traffic information plus estimated travel time. |
Stefan
| Phase | Action | Thoughts/emotions | Pain points | Opportunities / Features |
|---|---|---|---|---|
| Planning | Searches 'jeepney routes' in Google, Reddit, and Google Maps, finds little, and screenshots the car route | "Nothing online explains how to use jeepneys." Curious | Jeepney routes are shown only as a start point with no stops, and there is no explanation of how jeepneys work. | Explain jeepney naming conventions and how to board in plain language. |
| Compares Grab price with a Google Maps car route and decides public transport is worth trying | "Grab every day is way too expensive." Curious | There is no cost comparison between public transport and ride-hailing in one view. | Route comparison showing time, cost, and comfort side by side. | |
| Screenshots directions in case the internet drops mid-journey | "I need a backup in case I lose signal." Uncertain | There is no offline access to route or stop information. | Downloadable offline route maps and stop alerts. | |
| Deciding | Walks around the street looking for a jeepney stop sign and finds none | "How do people even know where to stand?" Confused | There are no fixed stops; boarding points rely entirely on local knowledge. | Mark the nearest jeepney pickup point on the map via GPS. |
| Stands at the roadside, watches locals wave down a jeepney, and copies them | "I think this is how you do it?" Uncertain | There is no guidance on how to flag, board, or pay for a jeepney. | Provide a step-by-step boarding guide: wave to stop, pass cash forward, say 'Para!' to exit. | |
| Detour | Boards a jeepney and passes cash forward but is unsure about the correct fare | "I have no idea if I am paying the right amount." Stressed | No fare information is available and the trip is cash-only with no official prices shown online. | Show an approximate cash fare estimate with a 'pay in cash' note before boarding. |
| Gets stuck in traffic with no update on how long it will take or whether to stay on | "Should I get off and try something else?" Stressed | There are no ETA updates, crowd information, or delay reasons during the ride. | Use an ETA confidence indicator and a delay reason card such as 'heavy traffic ahead'. | |
| Misses his stop, gets off too late, and walks back | "I have no idea where I am right now." Lost | There is no stop alert and no clear way to know when to get off without local knowledge. | Offer a GPS-based stop alert that also works offline. | |
| Loses internet signal while walking, opens Grab, and switches to ride-hailing | "I can not afford to get more lost, just taking Grab." Frustrated | Signal loss kills navigation, with no fallback for unfamiliar areas. | Provide an offline-ready walking path to the destination with safety context. | |
| Arrival | Arrives at the destination after spending heavily on Grab despite trying public transport | "I tried, but I still ended up spending the same." Disappointed | The cost savings of public transport disappear because of failed navigation and Grab fallback. | Show a trip summary with actual versus estimated cost and modes used. |
| Defaults back to Grab for the rest of his stay and gives up on jeepneys | "It is just not worth the stress of getting lost again." Disappointed | One bad experience permanently kills confidence to try local transport again. | Add a confidence-building flow that saves successful routes and surfaces familiar options first next time. |
Main pain points
1. Uncertainty and unpredictability. ETAs shifted mid-journey without explanation, and commuters added 30 to 45 minute buffers just to feel safe.
2. Information fragmentation. Users juggled 2 to 4 apps for a single trip, with no tool covering multimodal travel end to end.
3. Jeepney and bus opacity. Routes, stops, and fares were either unavailable digitally or impossible for outsiders to interpret.
4. No real-time conditions data. There was no structured crowd density, flood routing, or live tracking, so people relied on Facebook groups and social feeds.
5. Safety anxiety. Safety shaped route choices more than price or time, yet no existing app structured or surfaced that information clearly.
6. Weather and flooding. Rain could completely transform the city's transport landscape without proactive warnings or rerouting built in.
Ideation
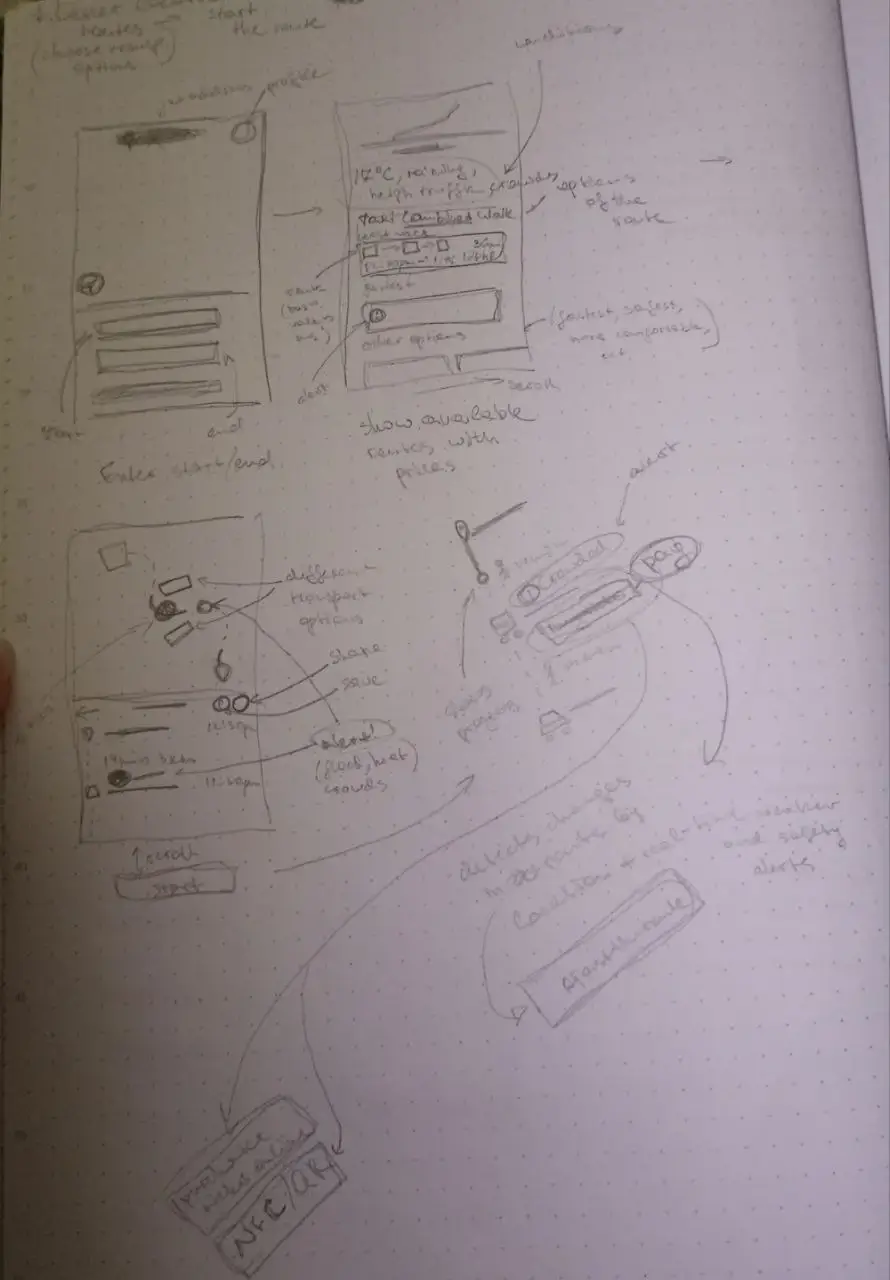
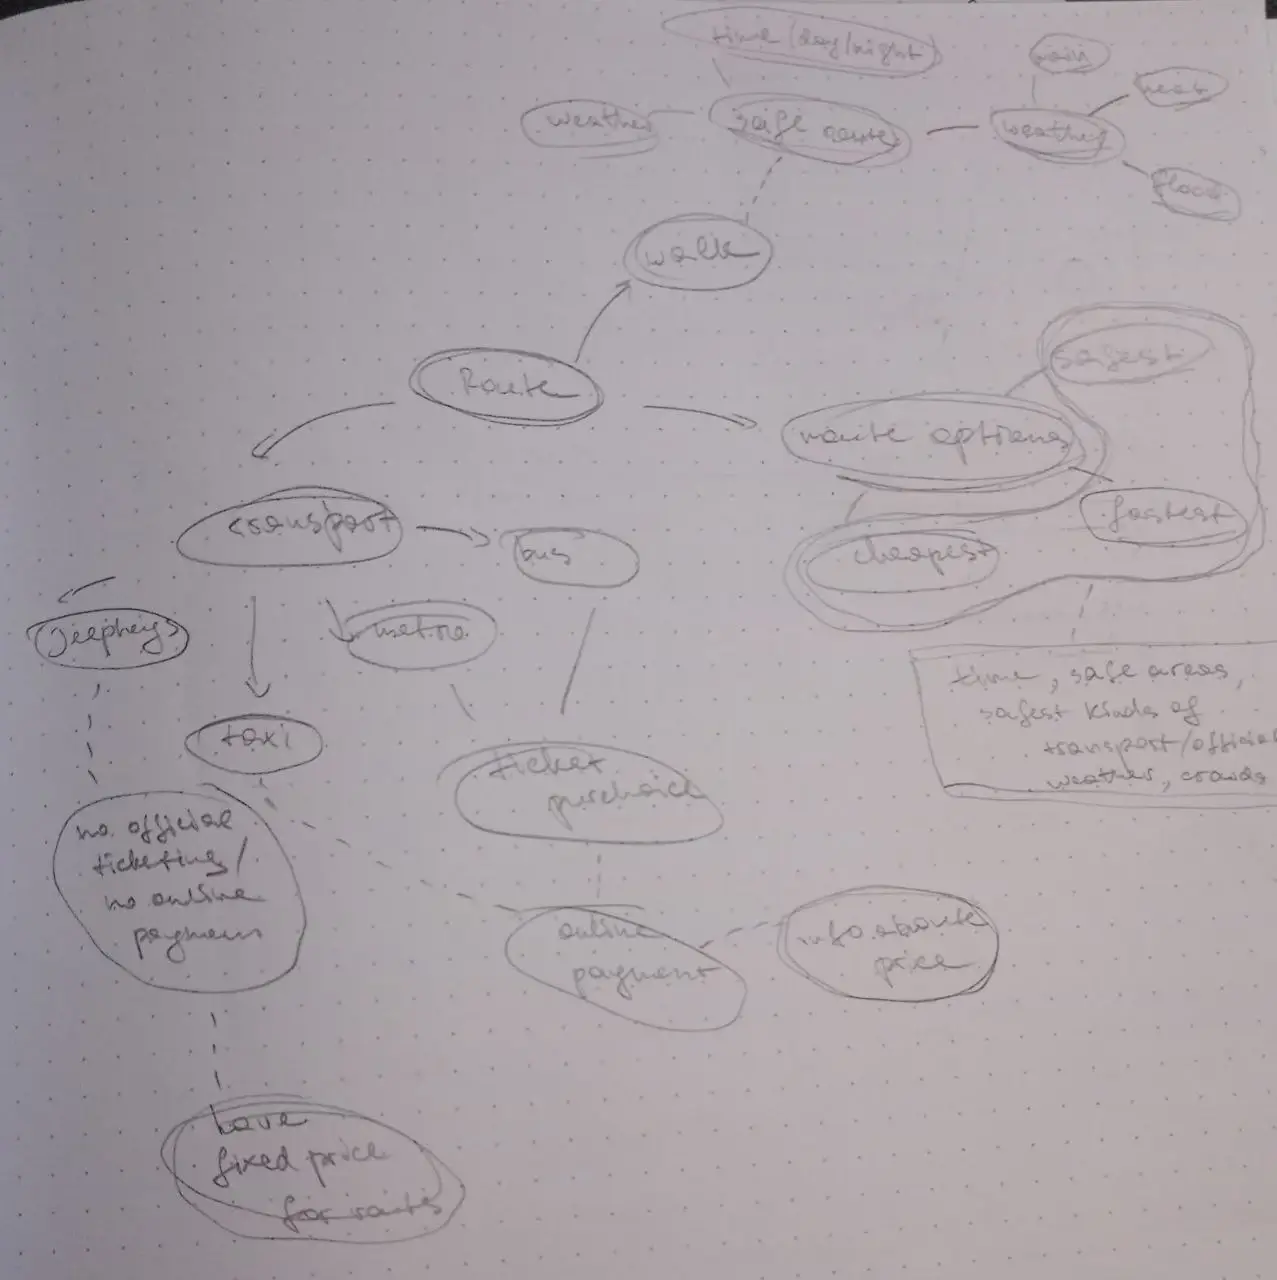
With the problems defined, I moved into exploring solutions. The first instinct was live jeepney tracking, but that idea failed immediately against the real constraints: jeepneys have no reliable GPS, no fixed stops, and no published data to build from.
The rest of the constraints followed the same pattern. No centralized API connected Manila's transport modes. Connectivity dropped underground. Traffic was too unpredictable for precise ETAs. Jeepneys were cash-only, so a unified payment system would have created a false expectation.
The core solution directions were clear: unify all transport information in one place, make jeepneys legible, compare routes the way people actually choose, and let users filter transport modes before route suggestions appear.
1. Unifying all information in one place. The most immediate need was not a new feature - it was consolidation. Route planning, real-time conditions, safety indicators, and fare information all needed to live in the same place, so users never had to leave mid-trip to find what they needed.
2. Making jeepneys legible. The jeepney problem was not only a data problem - it was a literacy problem. The response was to show approximate route bands, explain naming conventions in plain language, surface the nearest boarding point via GPS, and display approximate cash fares with a clear note that digital payment was not supported.
3. Route comparison that matches how people actually choose. Real decisions in Manila involve time, cost, safety, comfort, and predictability all at once, so the comparison view needed to surface those trade-offs together.
4. Transport mode filtering before route suggestions. Showing every option upfront increased hesitation, especially for unfamiliar modes. Letting users choose which transport modes they were comfortable with before routes appeared reduced cognitive load and sped up decisions.
Predictability & trust
HMW proactively explain why a route is delayed so users do not feel out of control?
Predictability & trust
HMW keep critical route information available when connectivity drops?
Information consolidation
HMW unify routes, fares, delays, and stop guidance in one place?
Information consolidation
HMW reduce the need to switch between Google Maps, MRT tools, Facebook groups, and Grab?
Information consolidation
HMW show multimodal route details in the order users actually need them?
Information consolidation
HMW make the trip feel manageable without overloading people with transport data?
Jeepney & bus legibility
HMW explain jeepney naming, conventions, and route direction so first-timers can read the windshield?
Jeepney & bus legibility
HMW show the nearest jeepney pickup point and teach users to wave and say 'Para!' to exit?
Jeepney & bus legibility
HMW use GPS to alert users when they are approaching their exit stop, even offline?
Safety & confidence
HMW adjust route suggestions based on time of day and lighting conditions?
Safety & confidence
HMW provide a walking path between modes that includes safety context, not just distance?
Safety & confidence
HMW suggest well-lit, busy boarding spots as defaults, especially at night or during rain?
Weather & external disruption
HMW reroute users around flooded roads before they encounter them, not after?
Weather & external disruption
HMW automatically adjust transport recommendations when rain is forecast?
Weather & external disruption
HMW push a weather-based travel advisory before users leave, so they can plan with full context?
Lo-fi wireframes
Concept
Defining the path
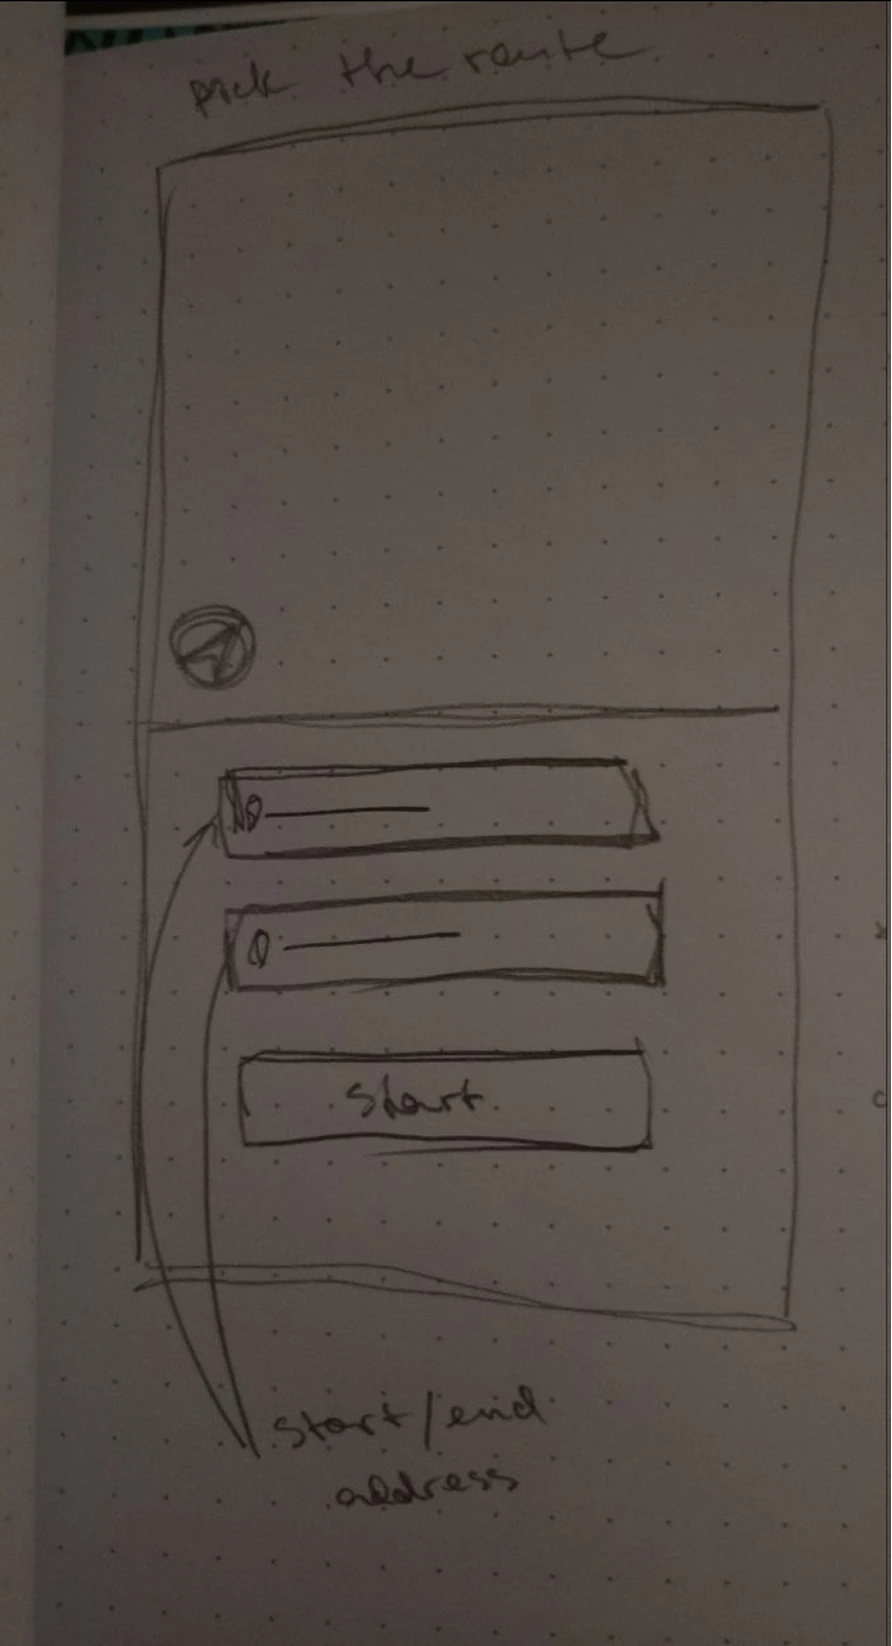
Why
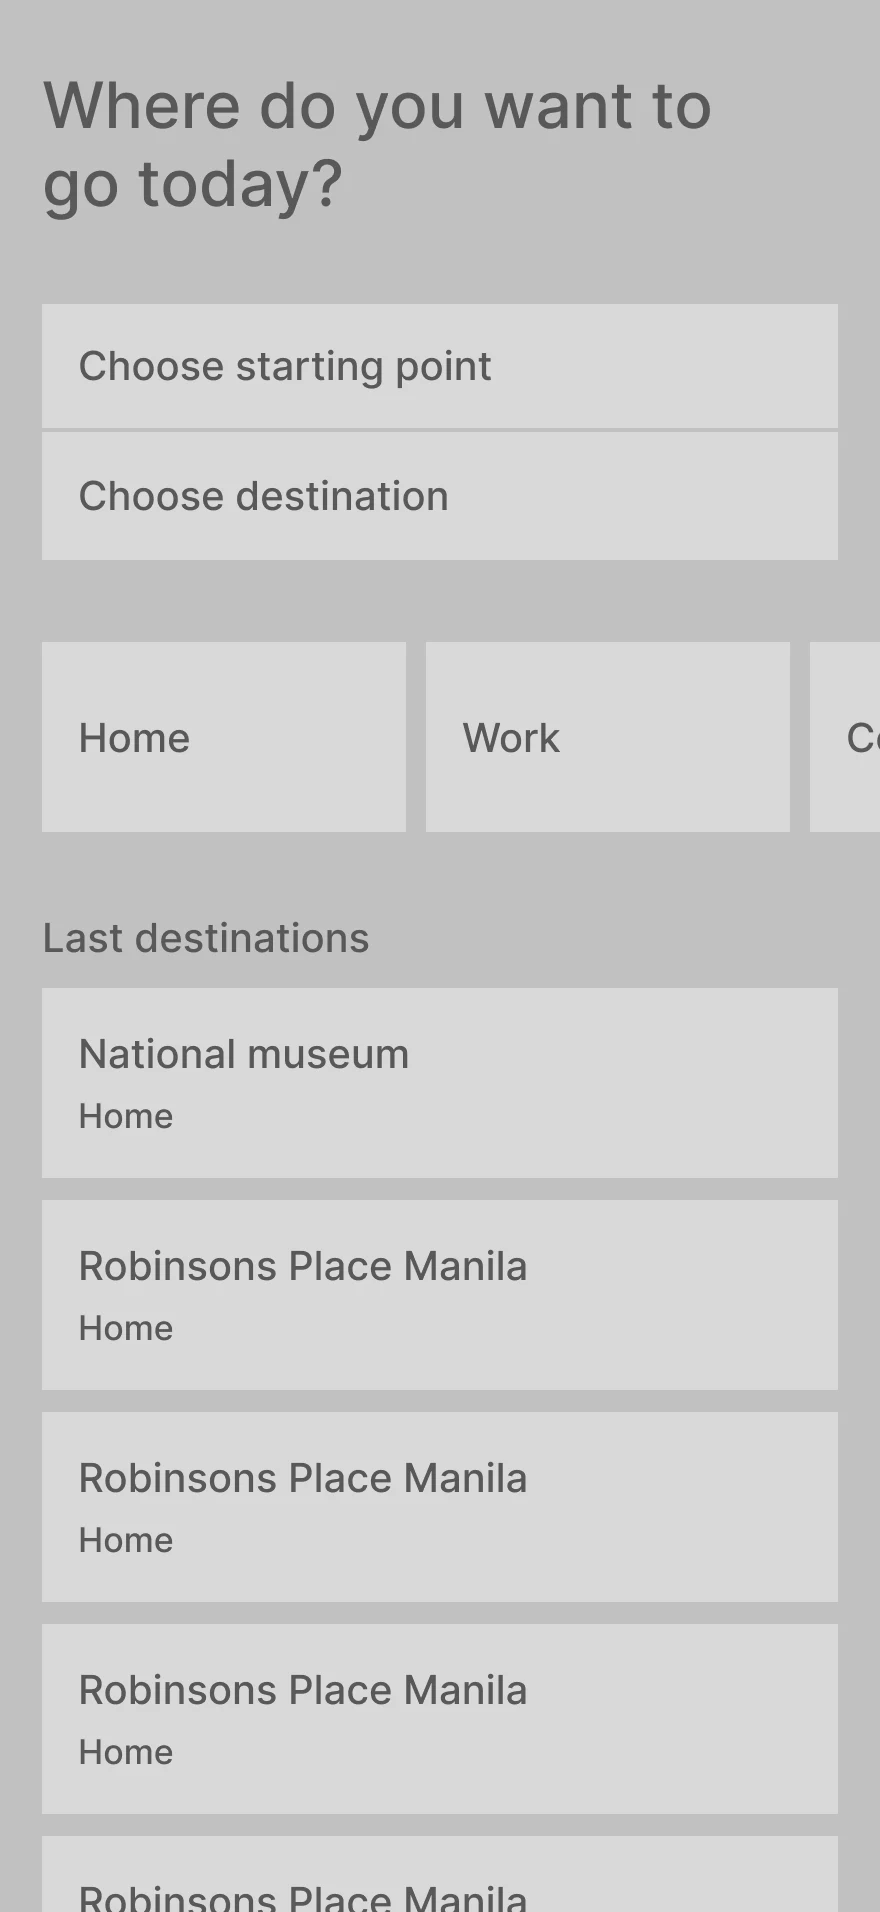
Starting with just start and end locations works because it reduces mental load, aligns with natural planning behavior, and sets up a progressive, guided experience.
Concept
Route options + transfers
Why
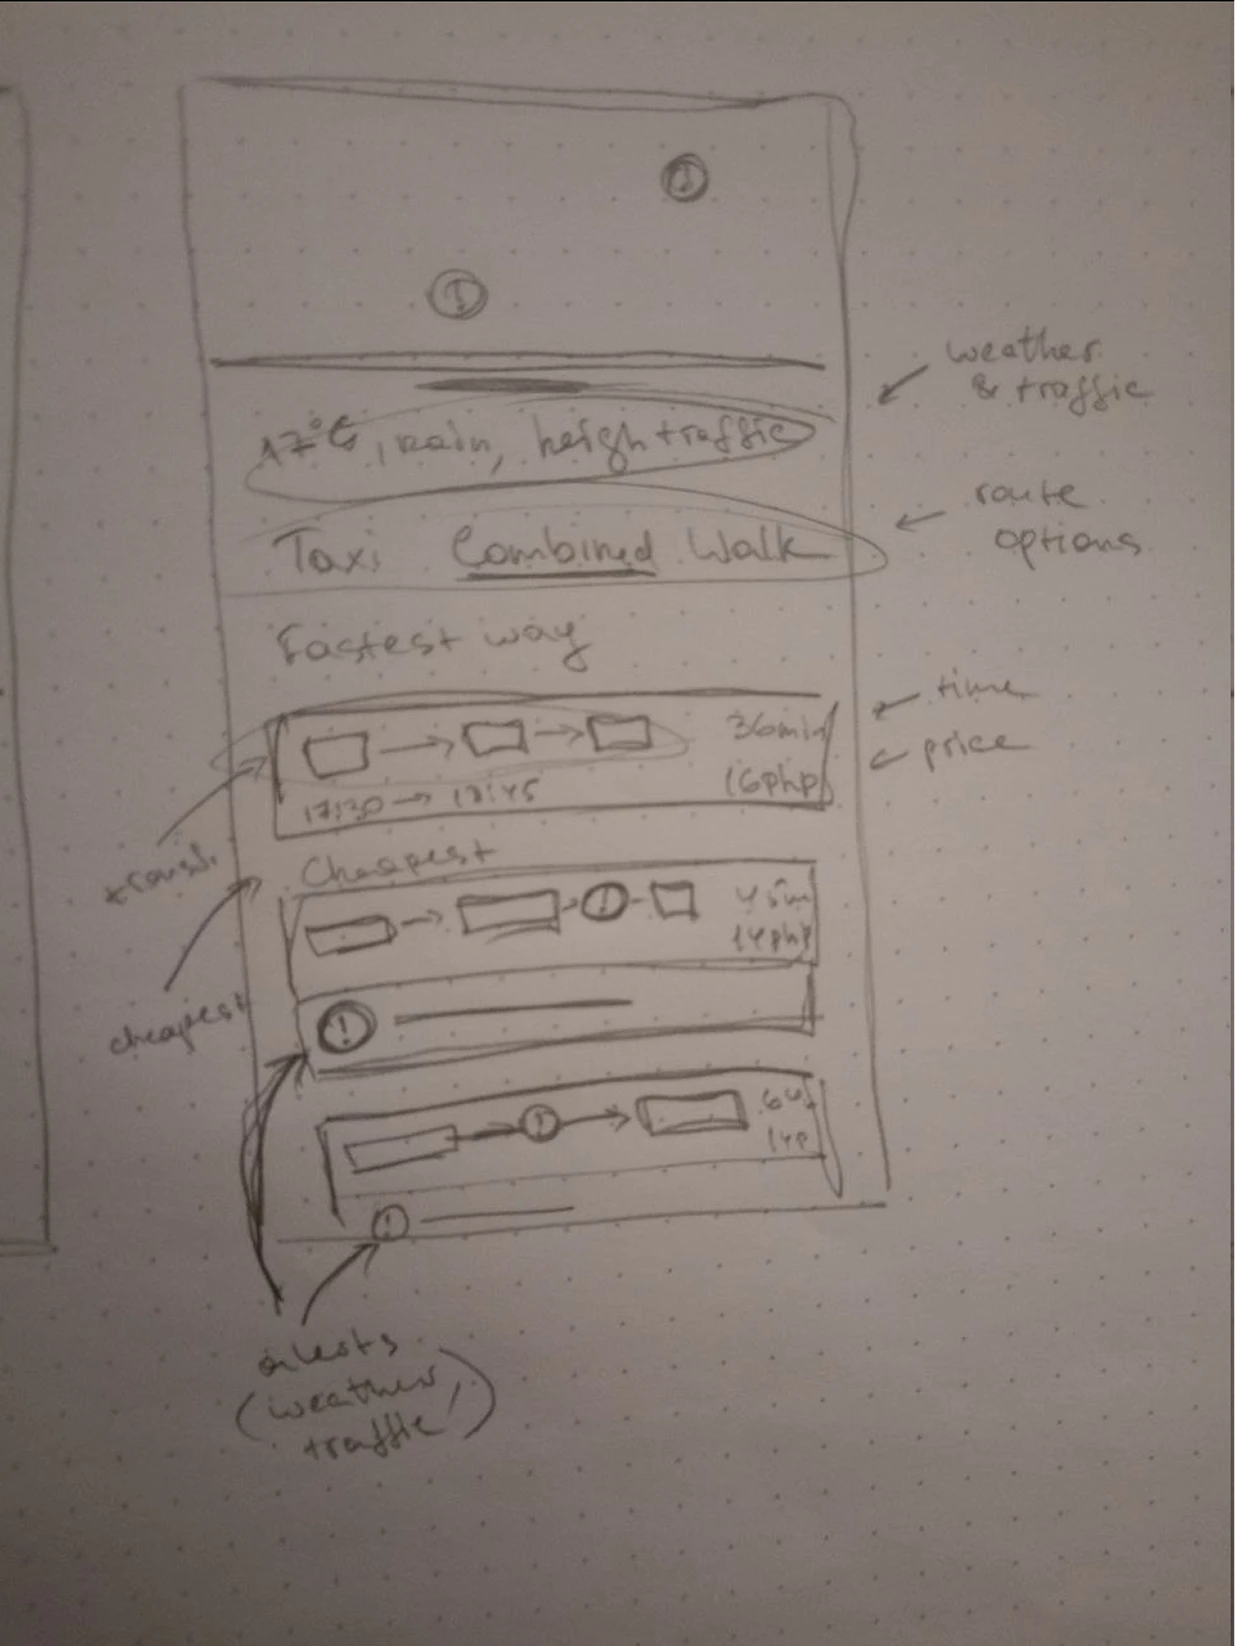
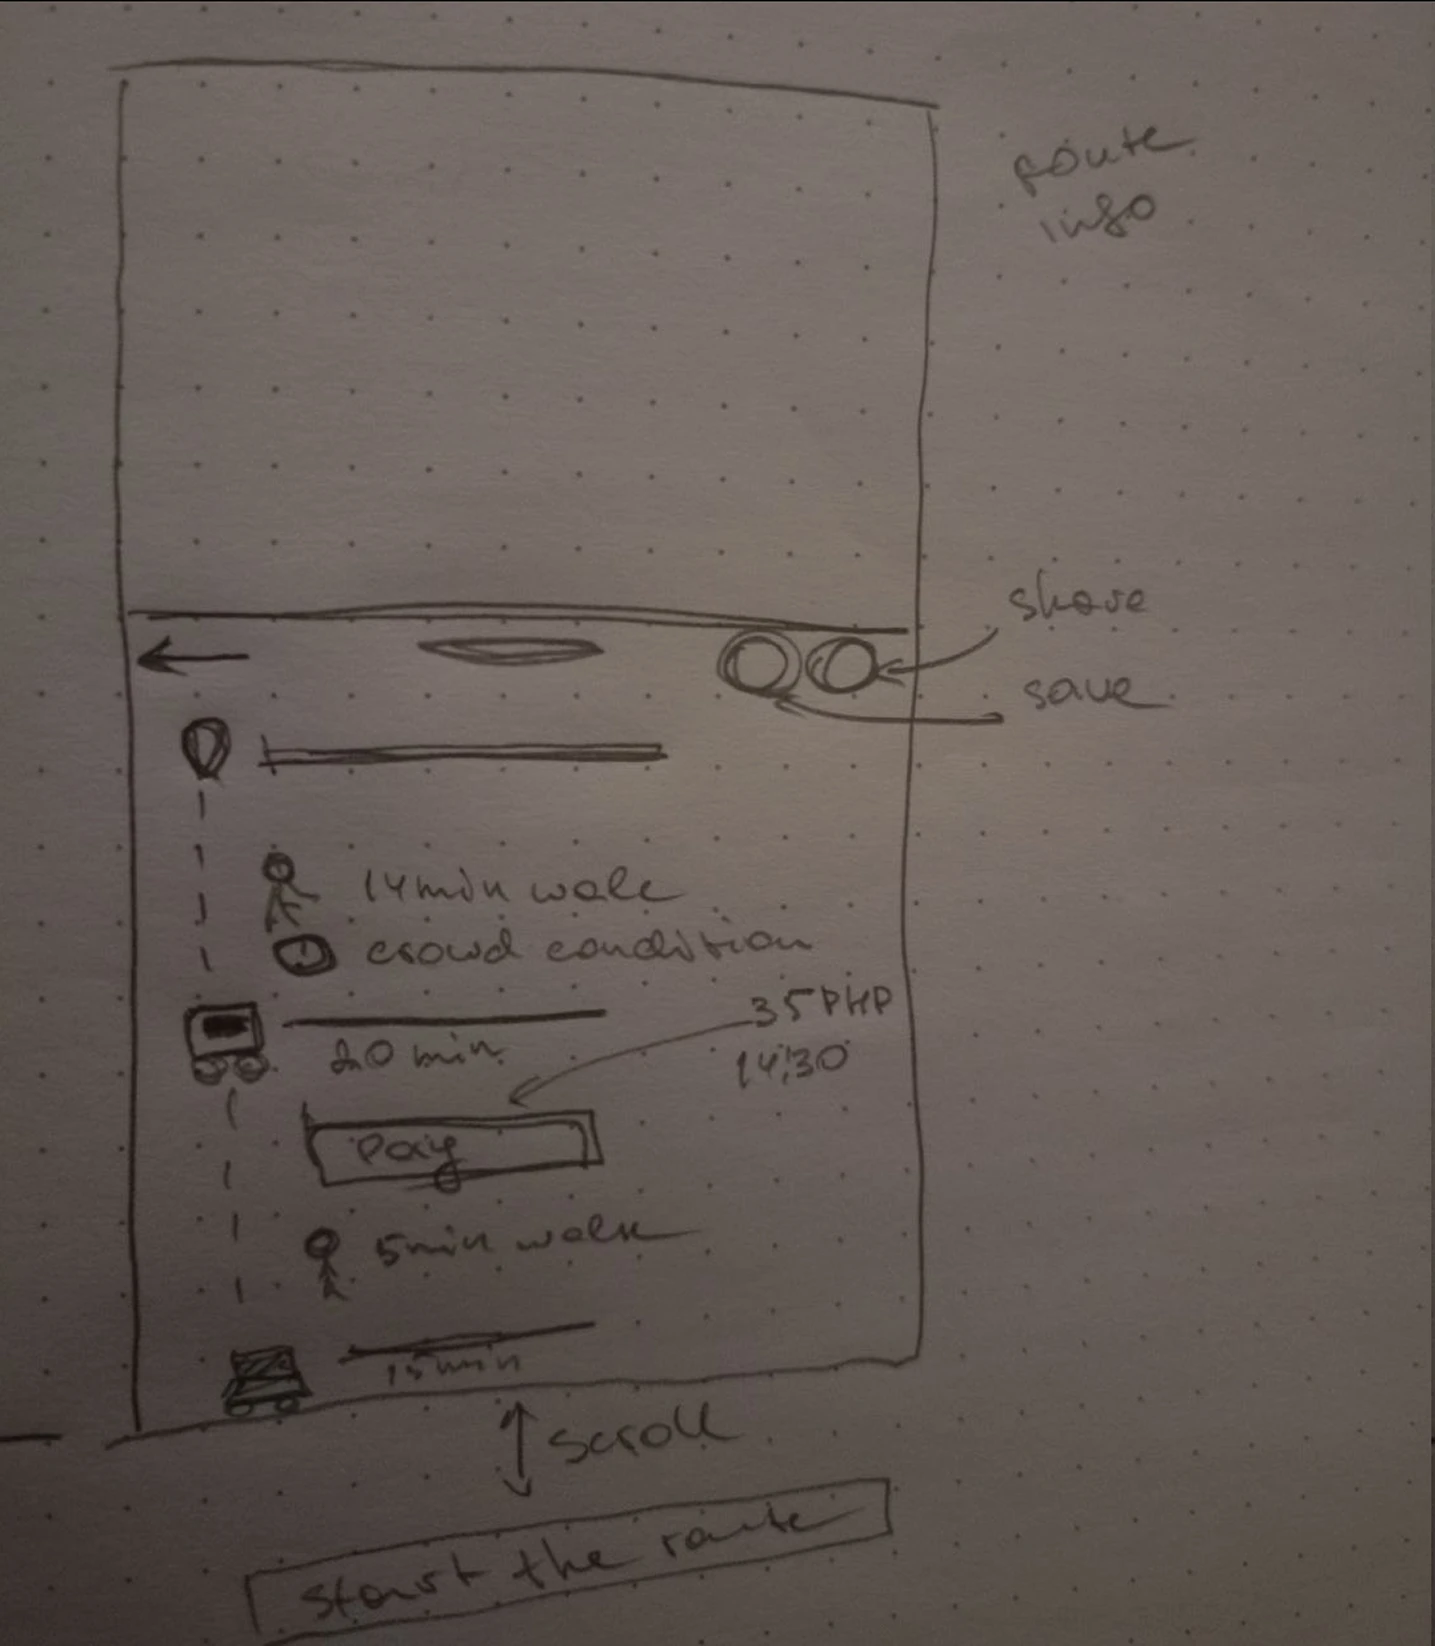
Combine different transport options in a single trip, show the full route, for example: Walk 5 min => jeepney => MRT => 10 min walk.
Details
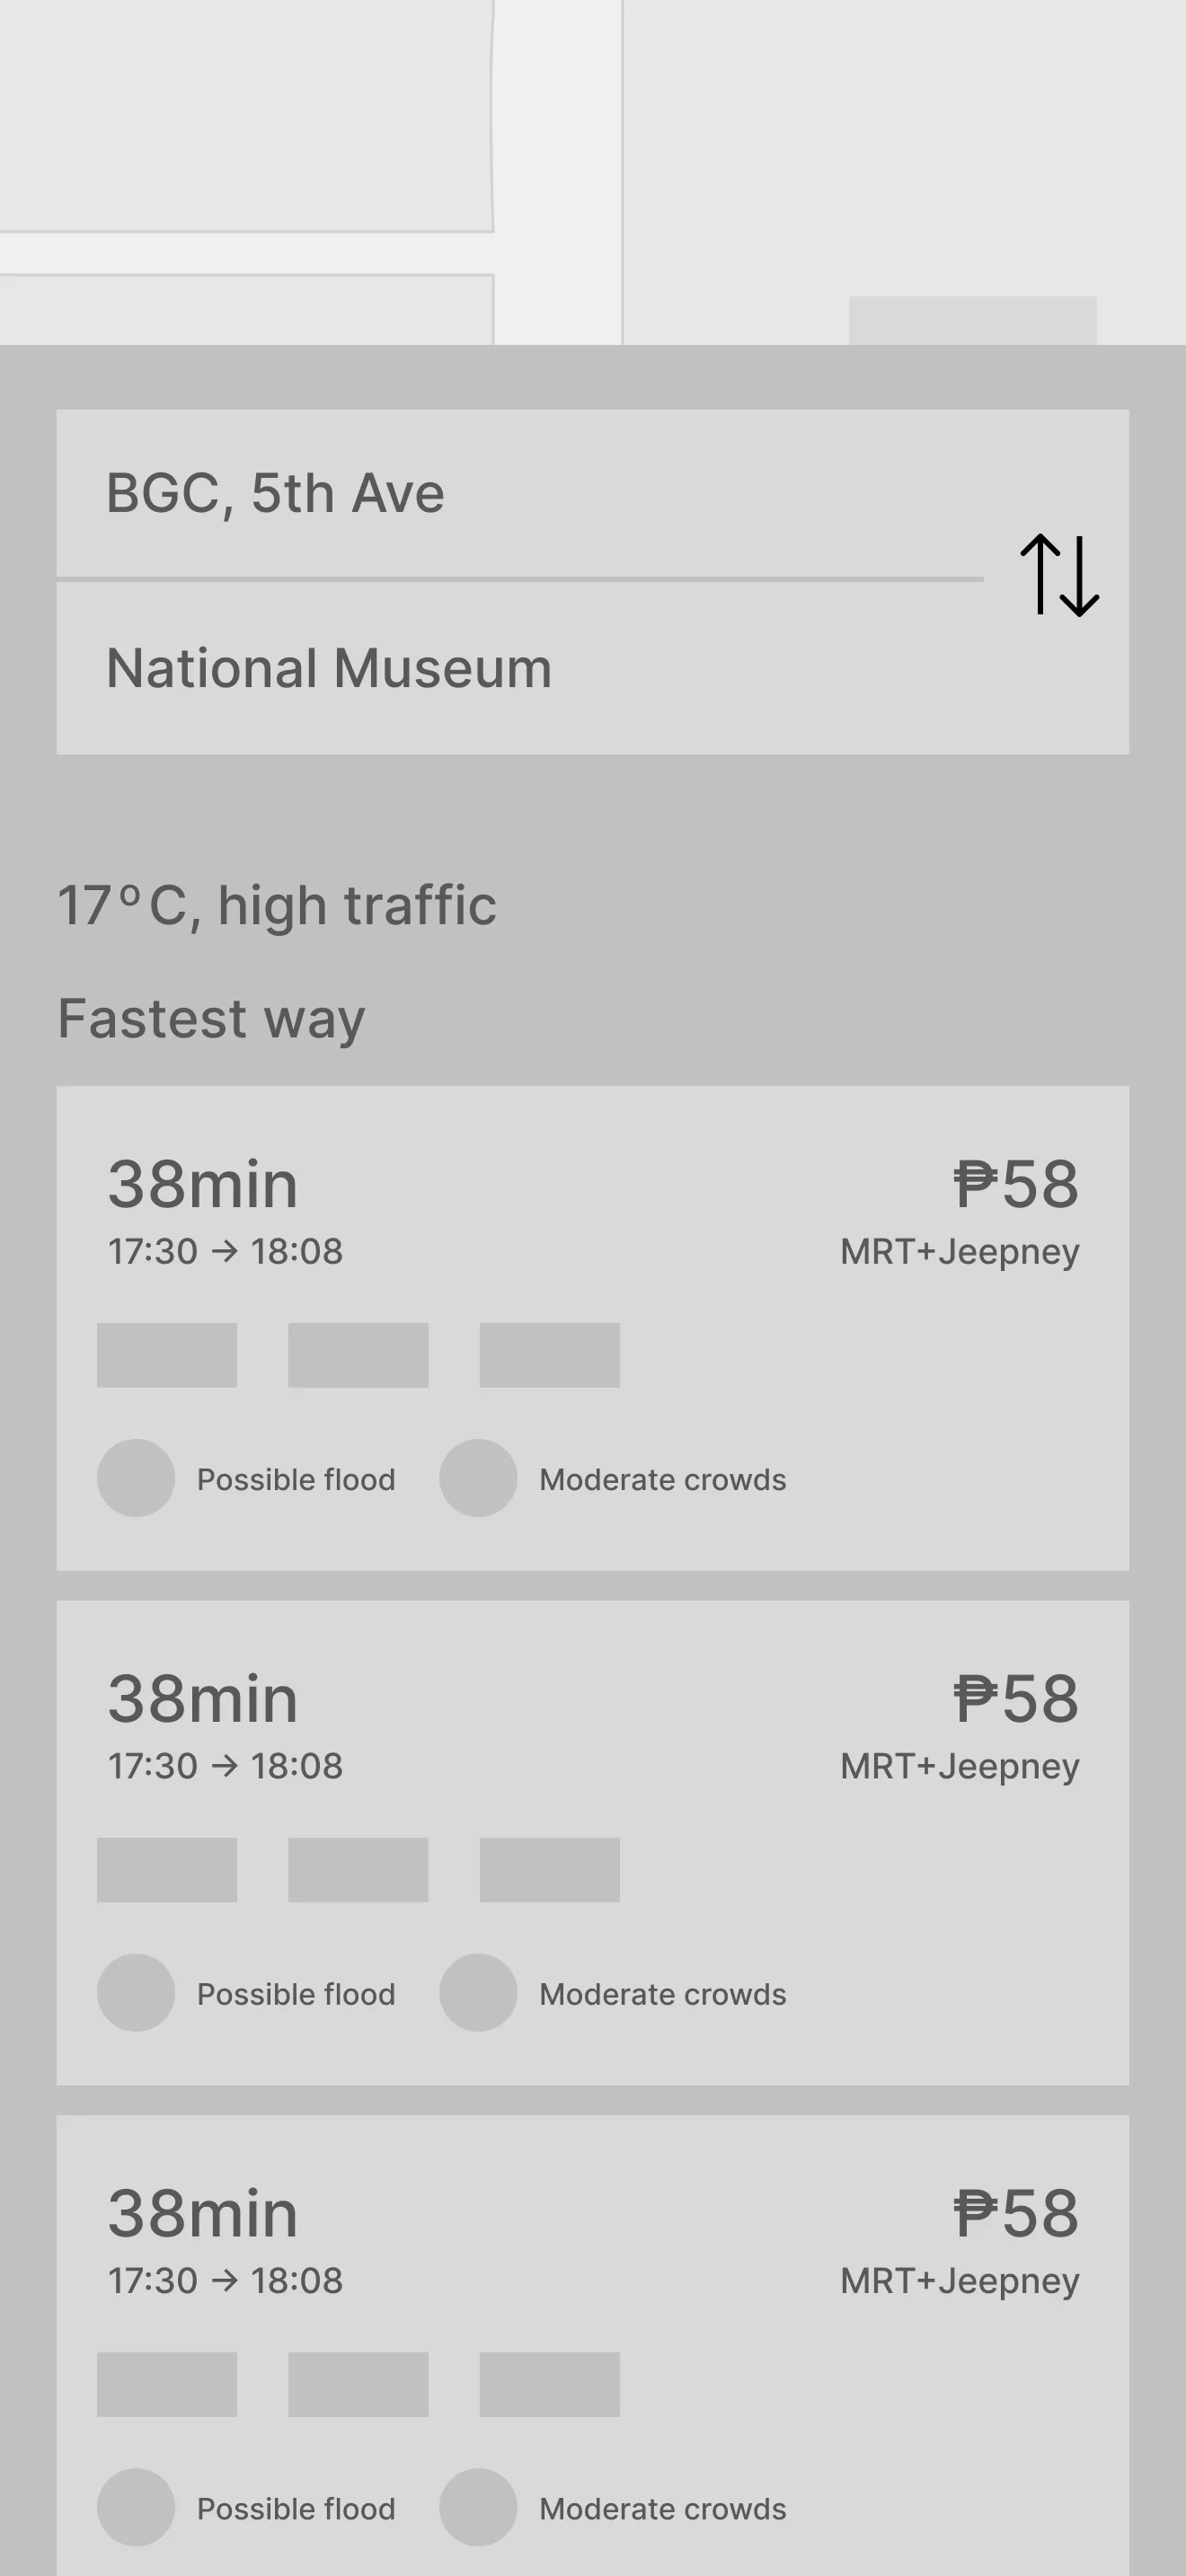
Allowing users to get from point A to point B without overthinking, showing all available route and transport options, and separating them by price, time, and safety lets users choose their priority while still highlighting the best option to avoid overwhelm.
Concept
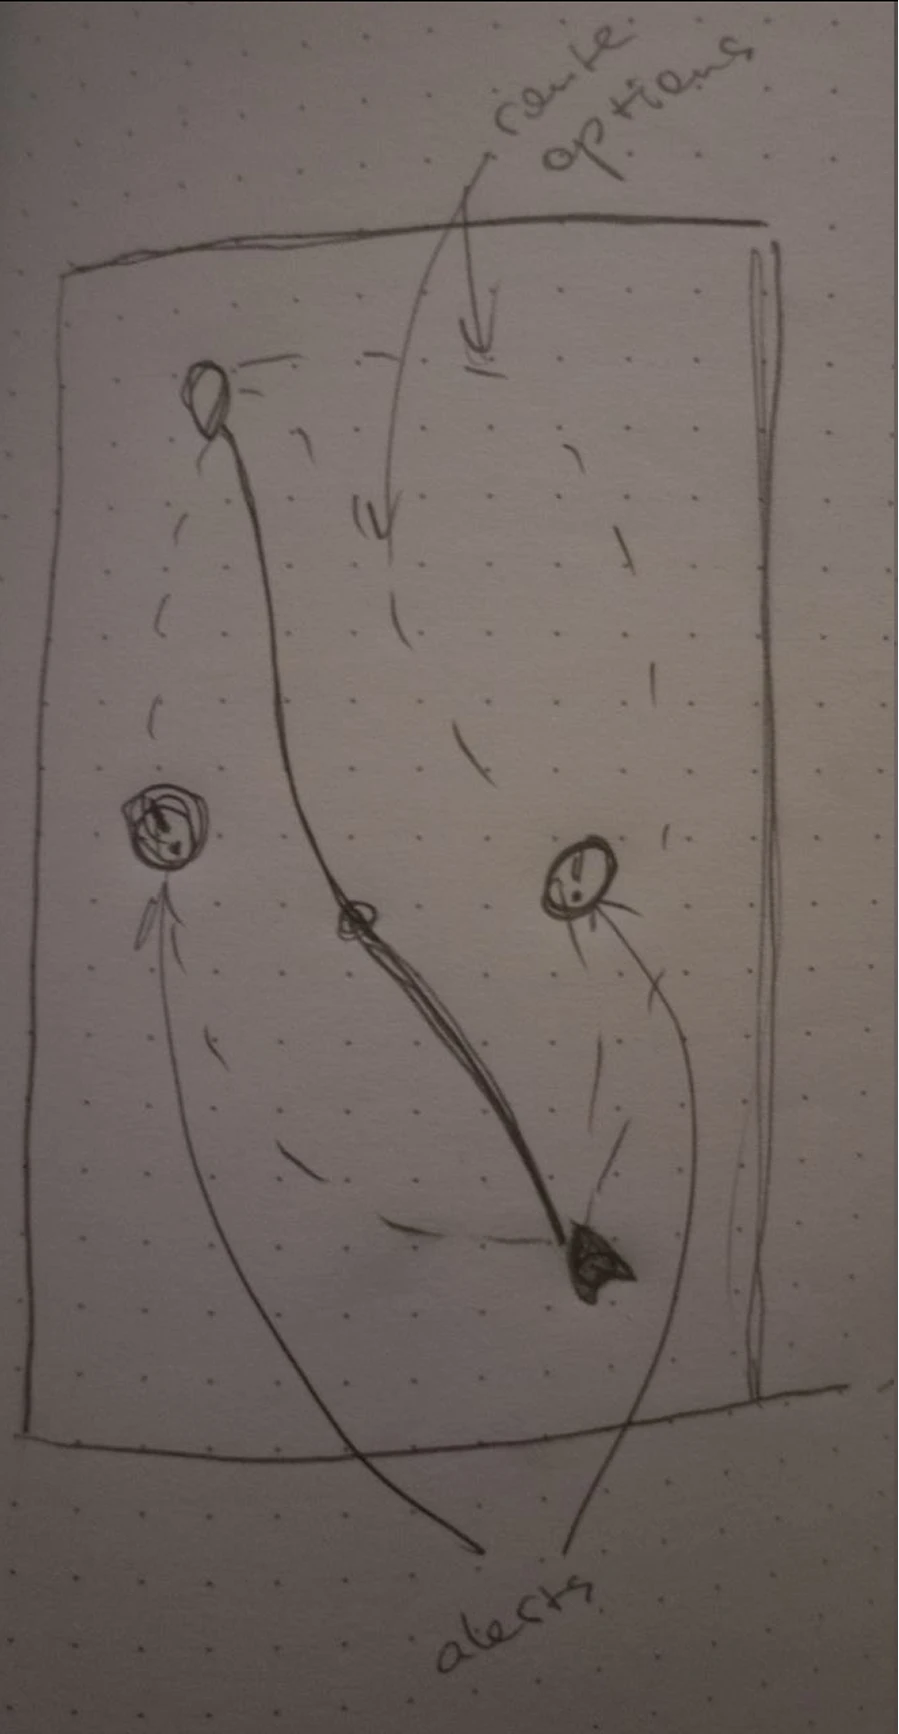
Show flooded, unsafe areas, crowds and weather conditions in real time
Why
Combine different transport options in a single trip, show the full route, for example: Walk 5 min => jeepney => MRT => 10 min walk.
Details
Visualizing crowds, floods, and alternative paths works because it externalizes uncertainty, allows comparison of multiple factors, supports real-time adaptive decisions, and builds user confidence, solving exactly the stress, unpredictability, and fragmented information problems.
Information Architecture
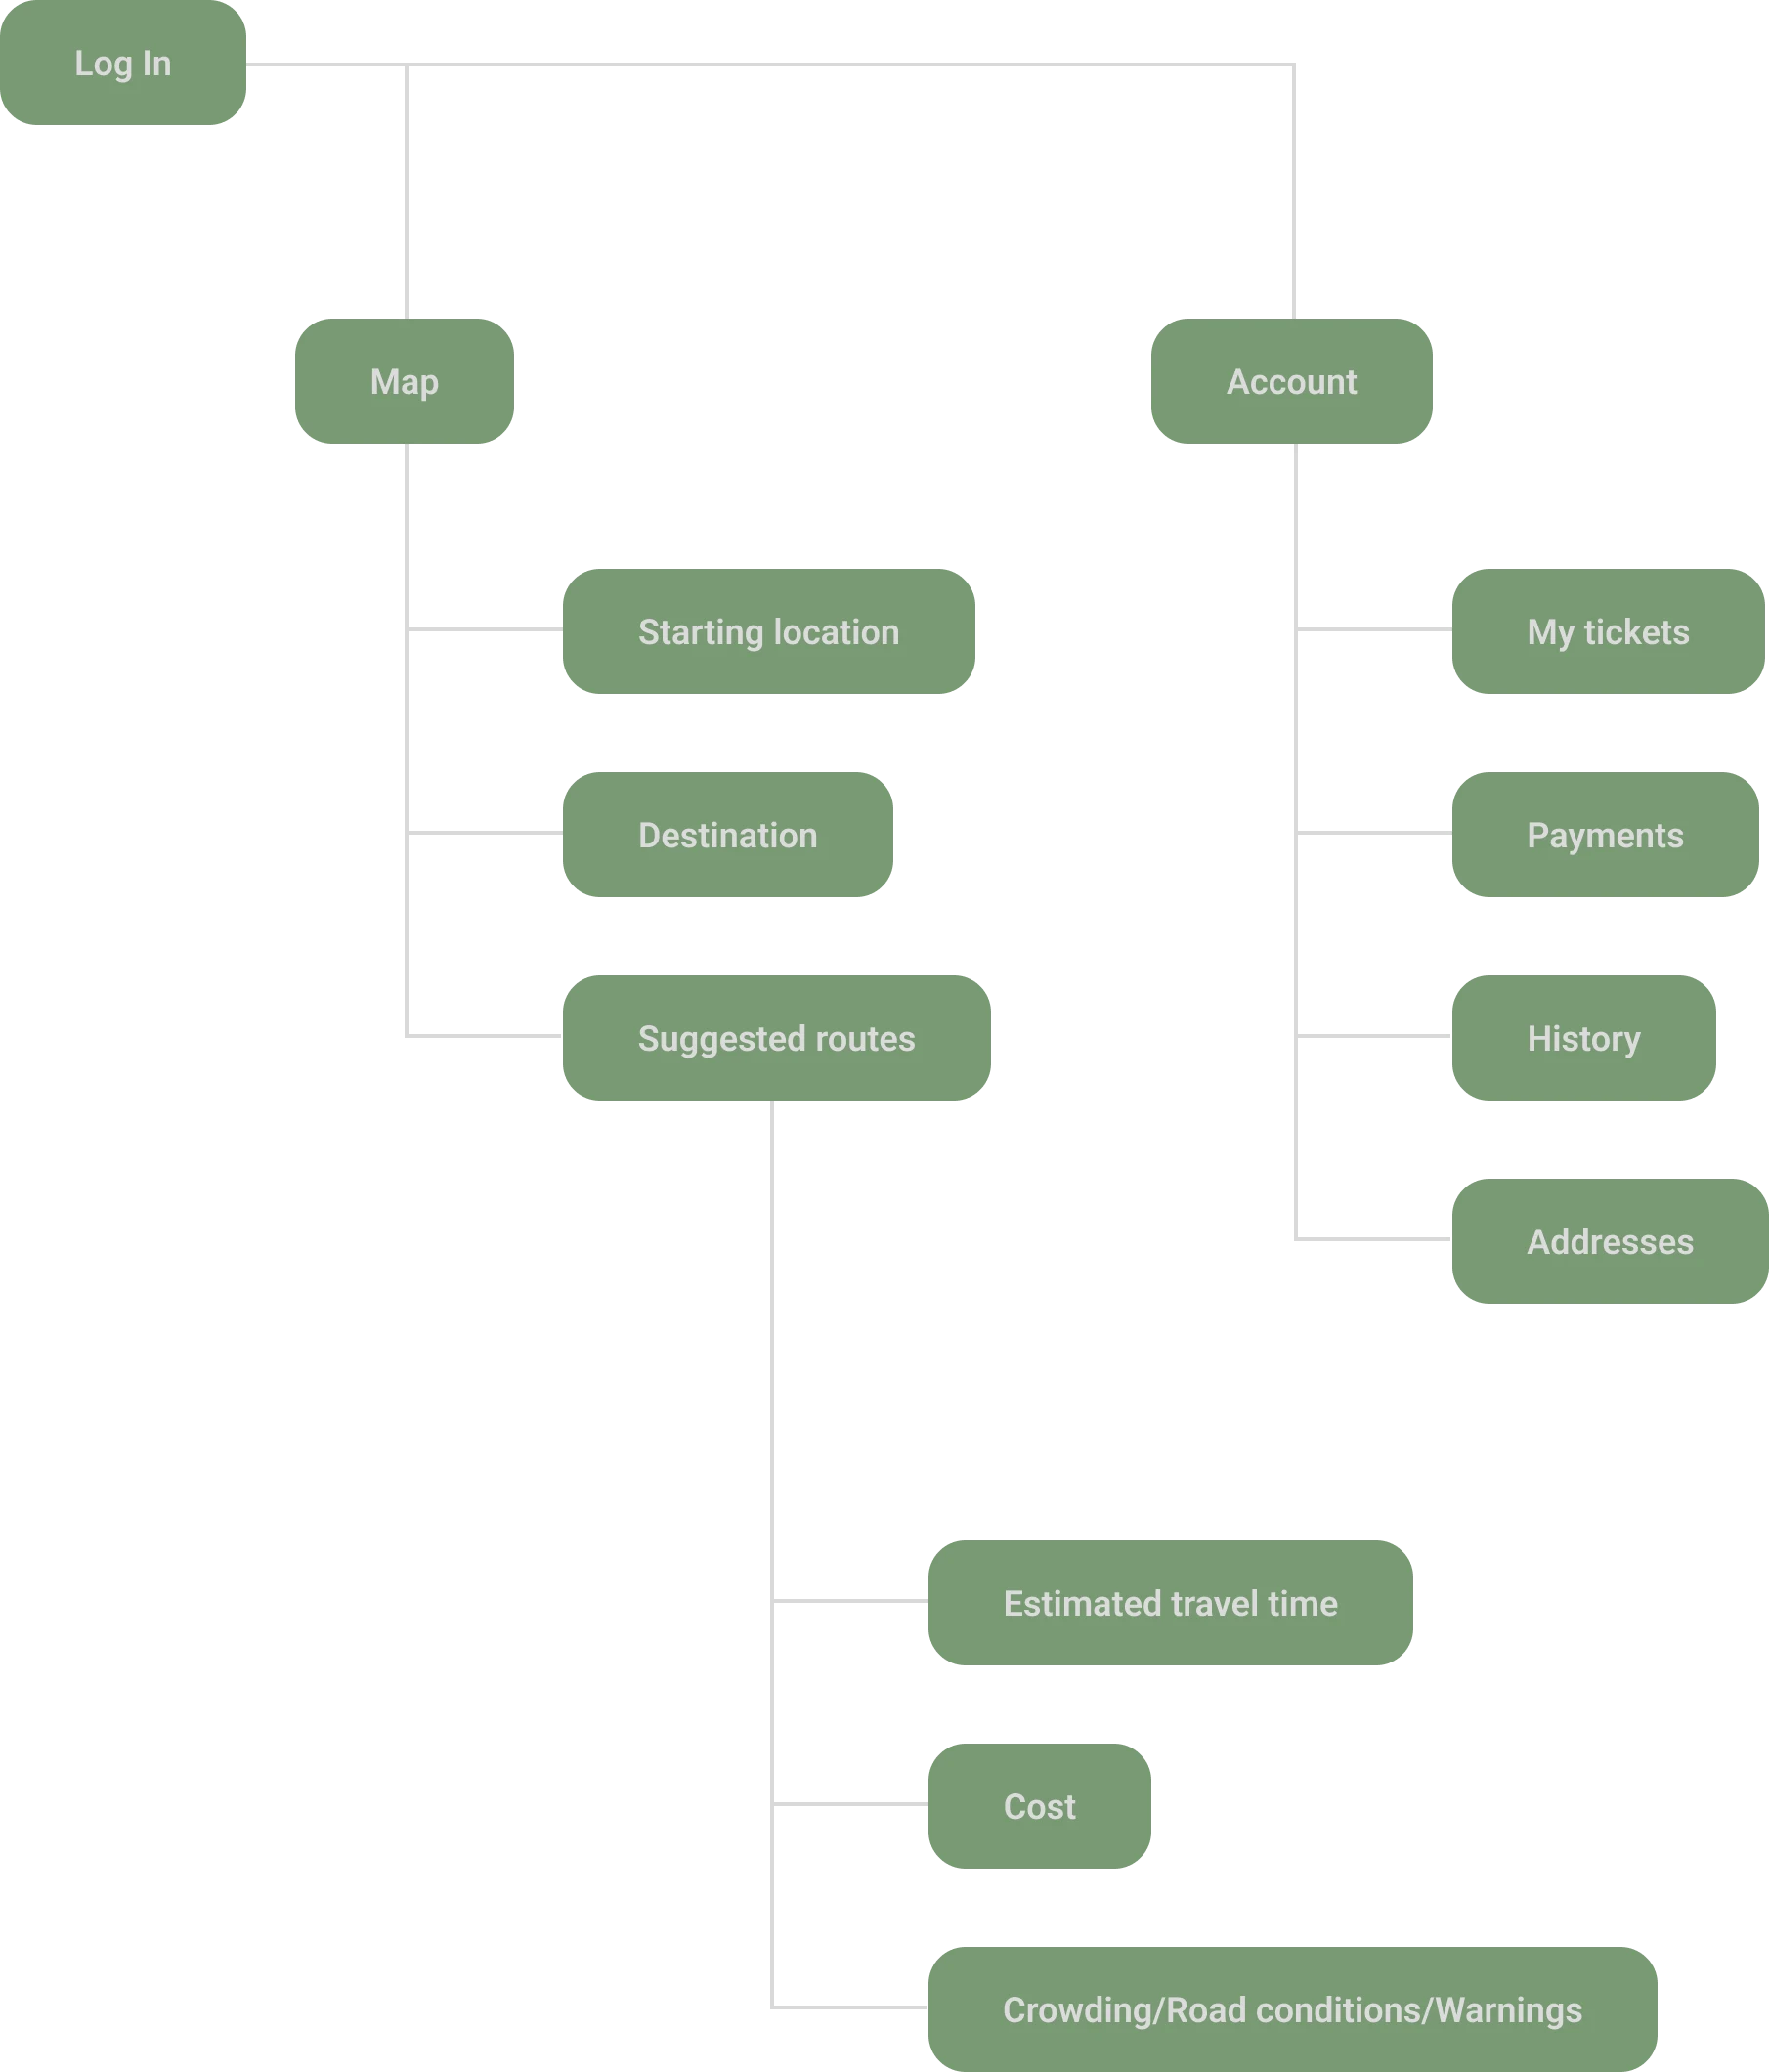
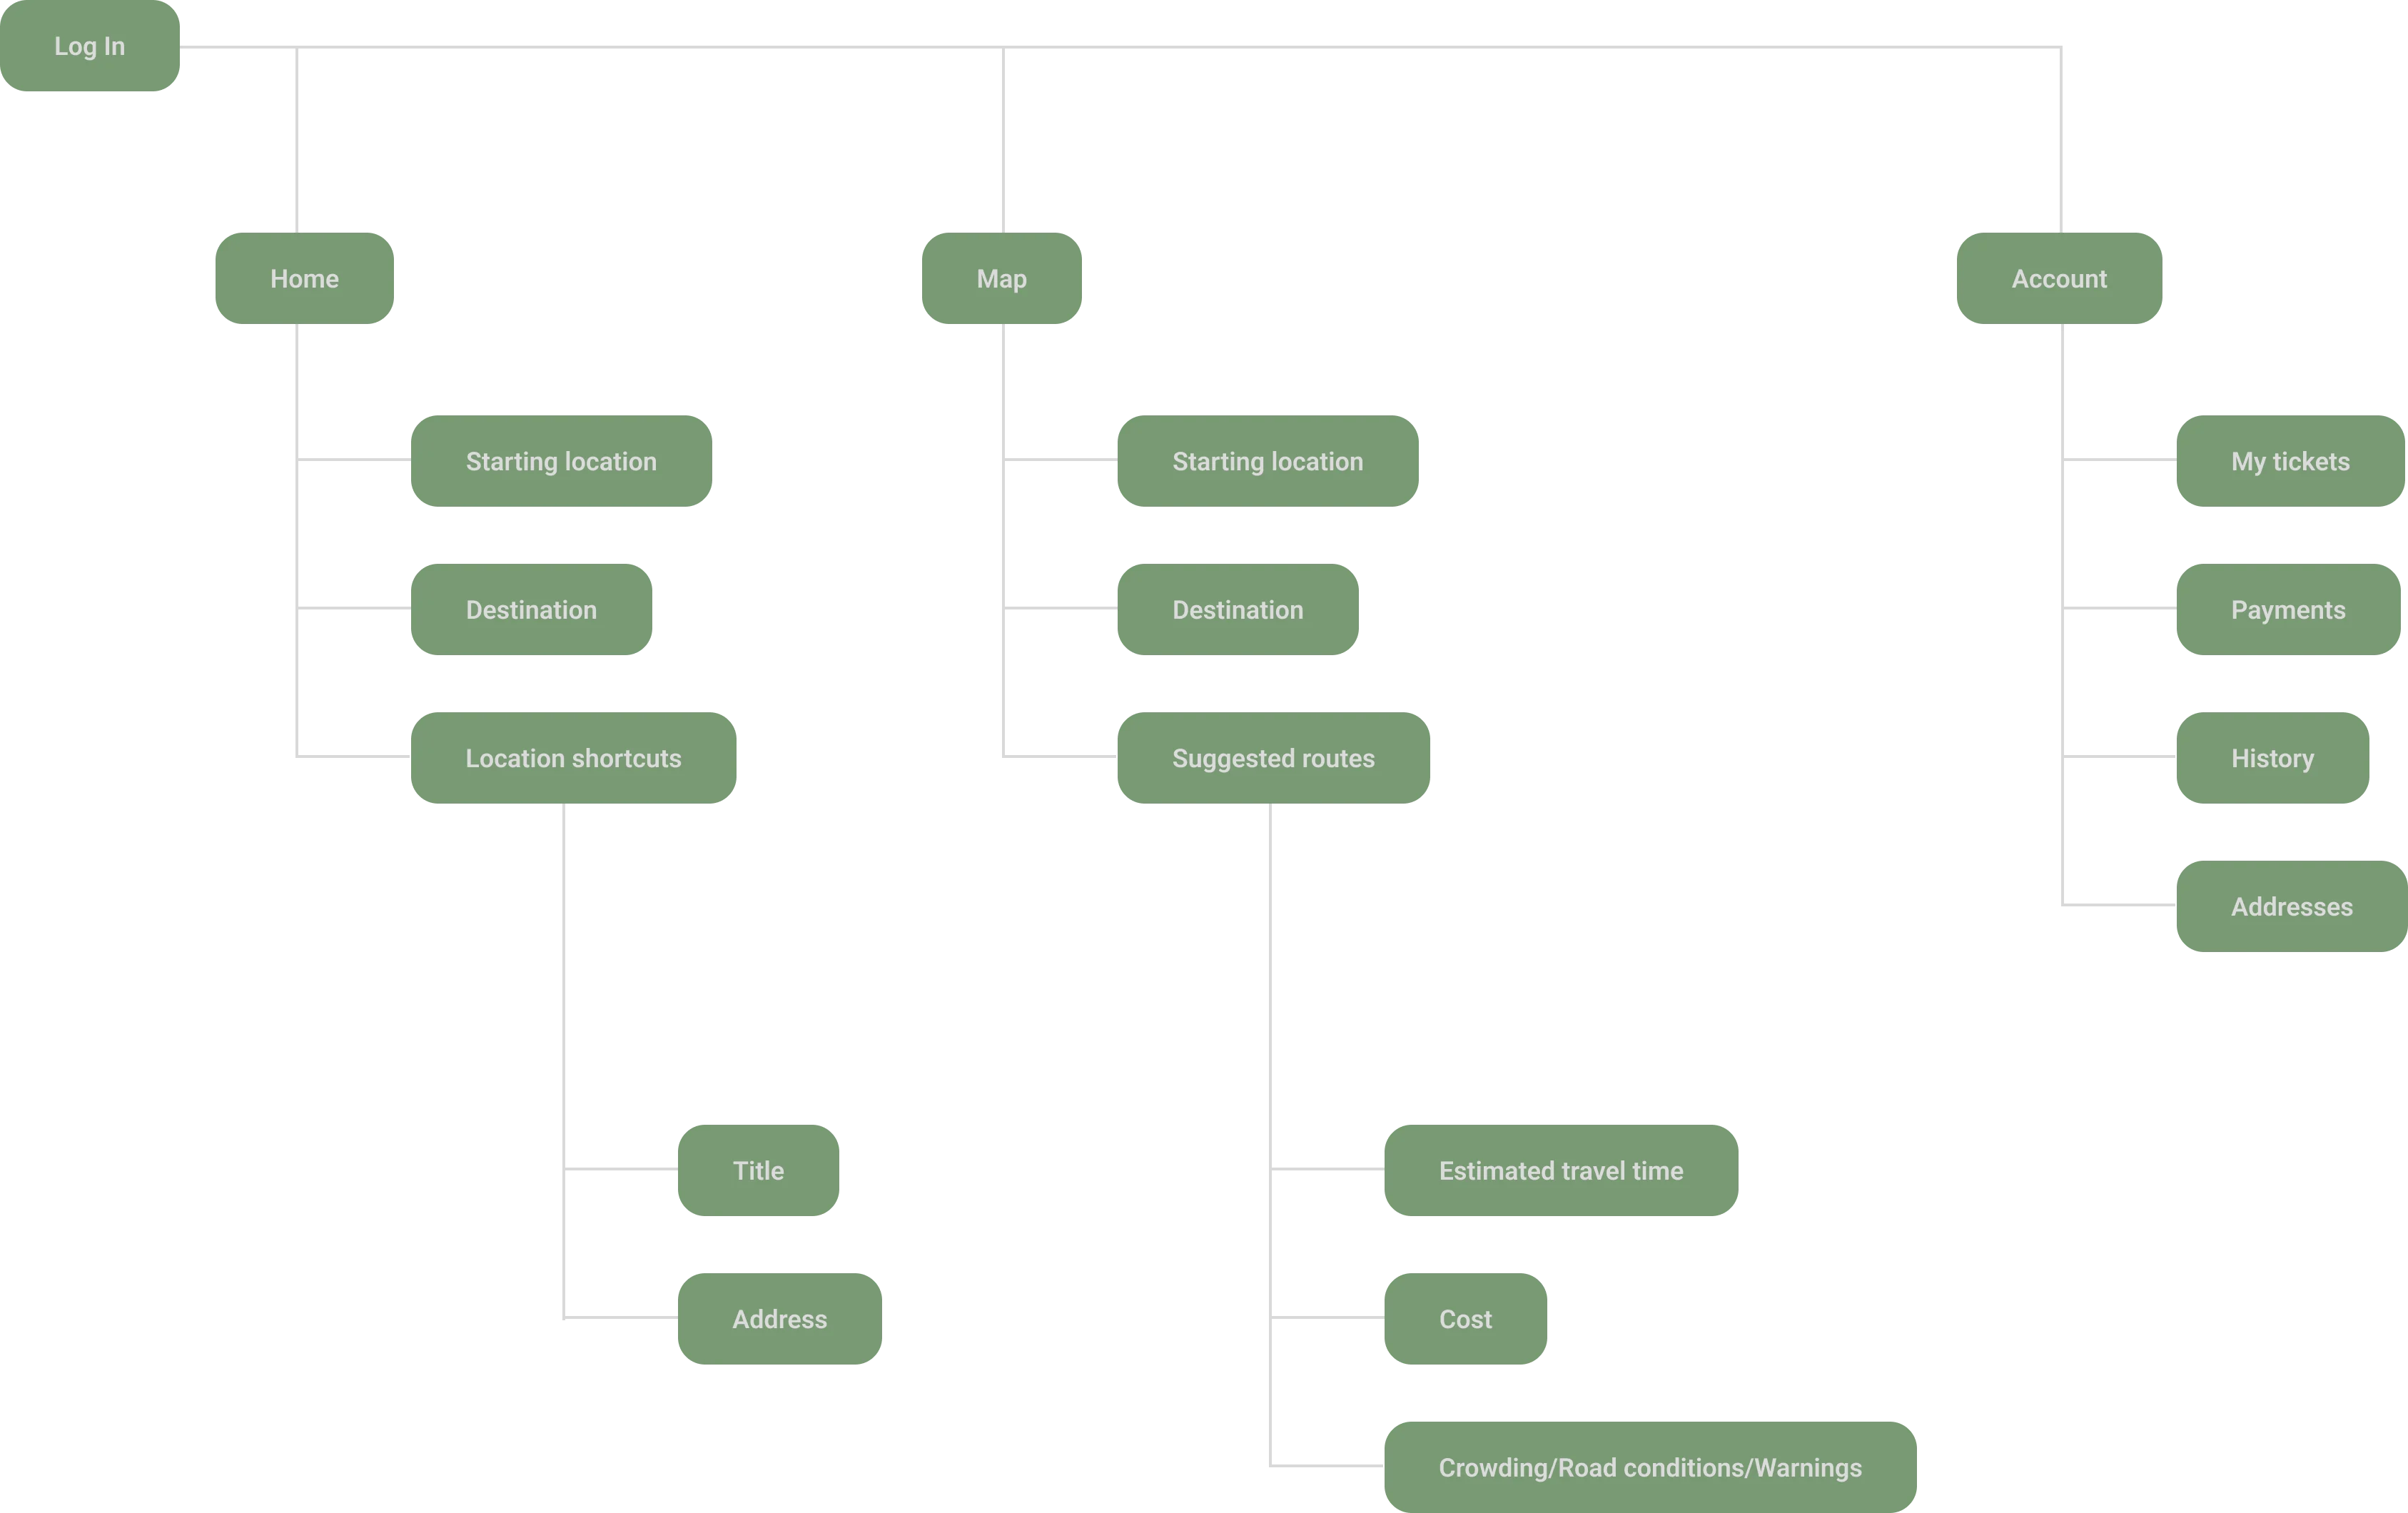
The sitemap went through a significant revision after early testing. An initial version included separate 'My Tickets' sections in account navigation. In testing, participants could not locate their purchased ticket after buying it, and several assumed digital payment was available on jeepney legs because no distinction was made.
Both sections were removed entirely. Payment now surfaces only at the relevant step in the route, and a purchased QR ticket appears immediately after payment with no additional navigation required.
Mid-fi wireframes
Screen
Pick the destination
Screen
Choose the route
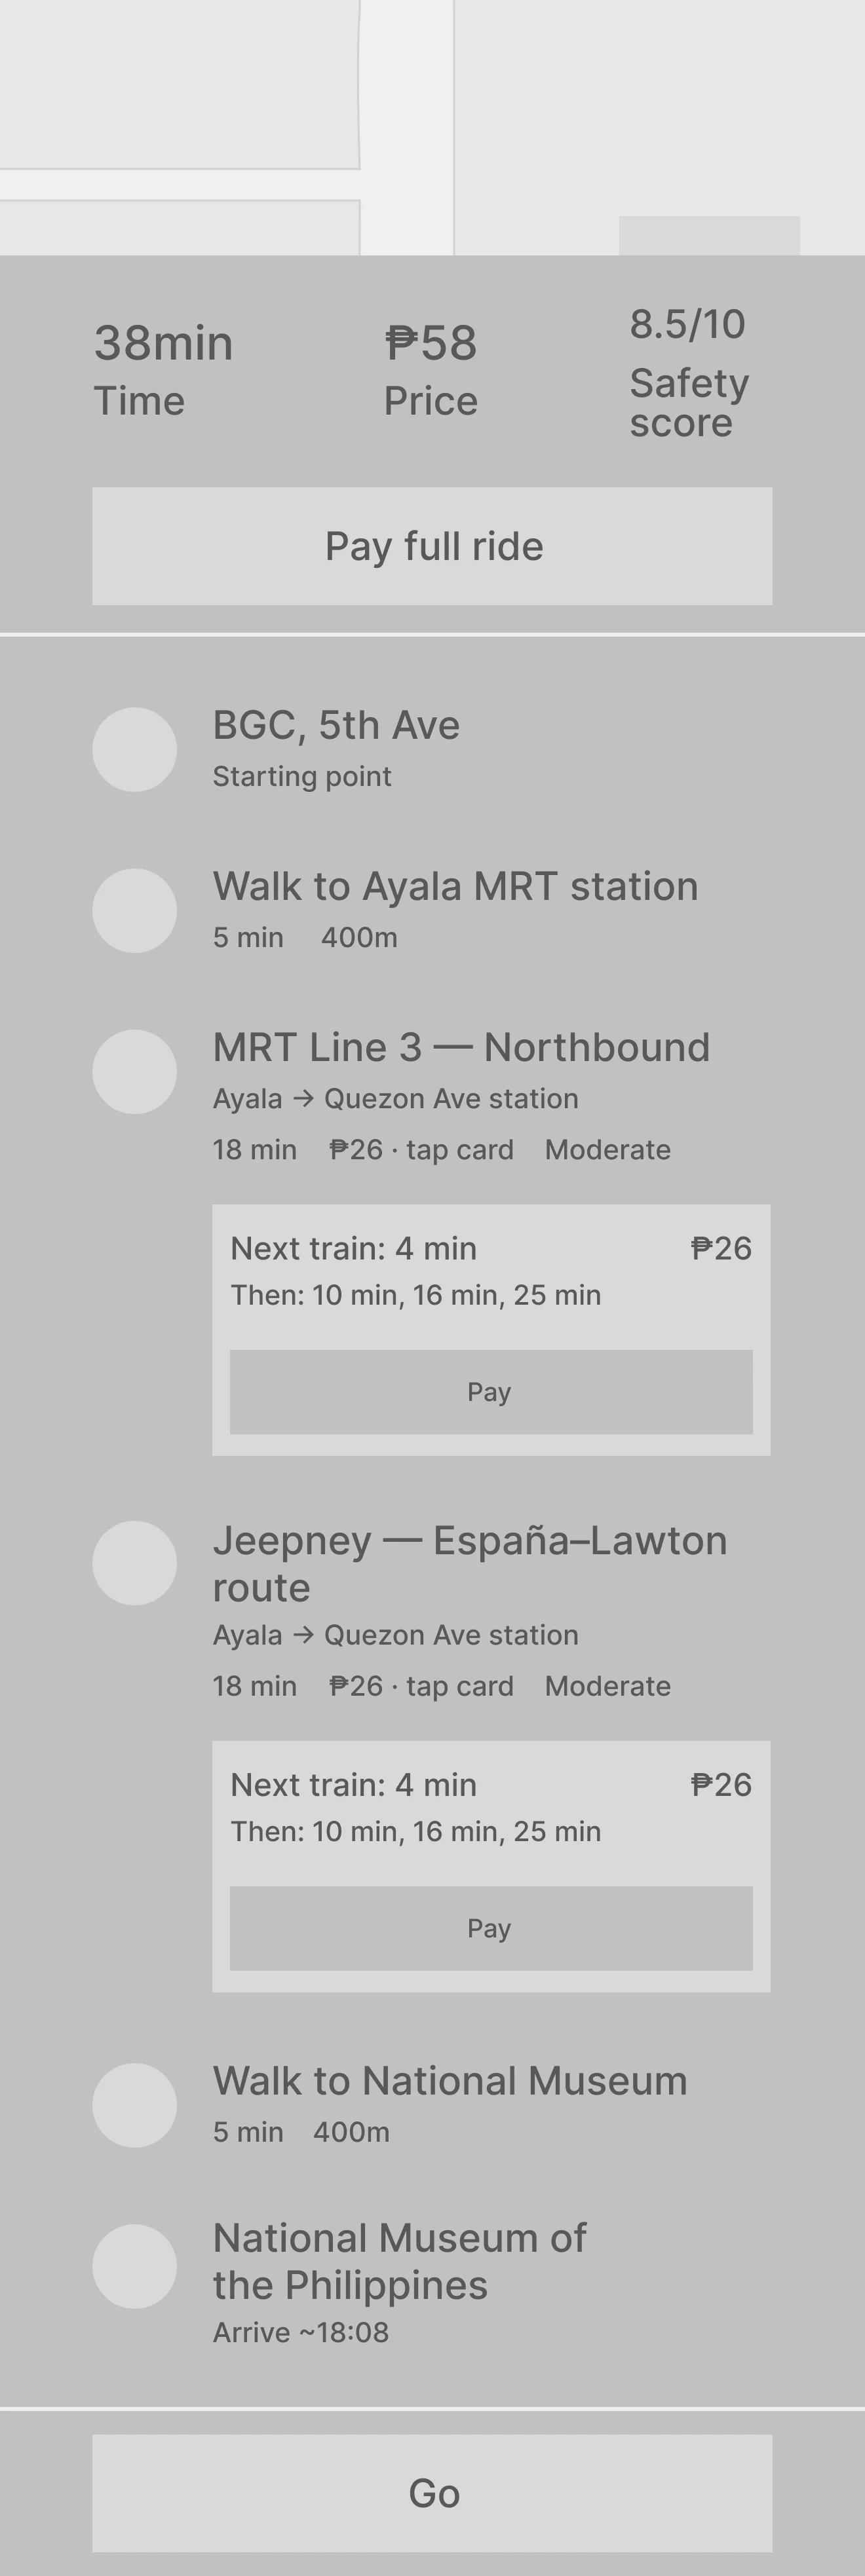
Screen
Route info
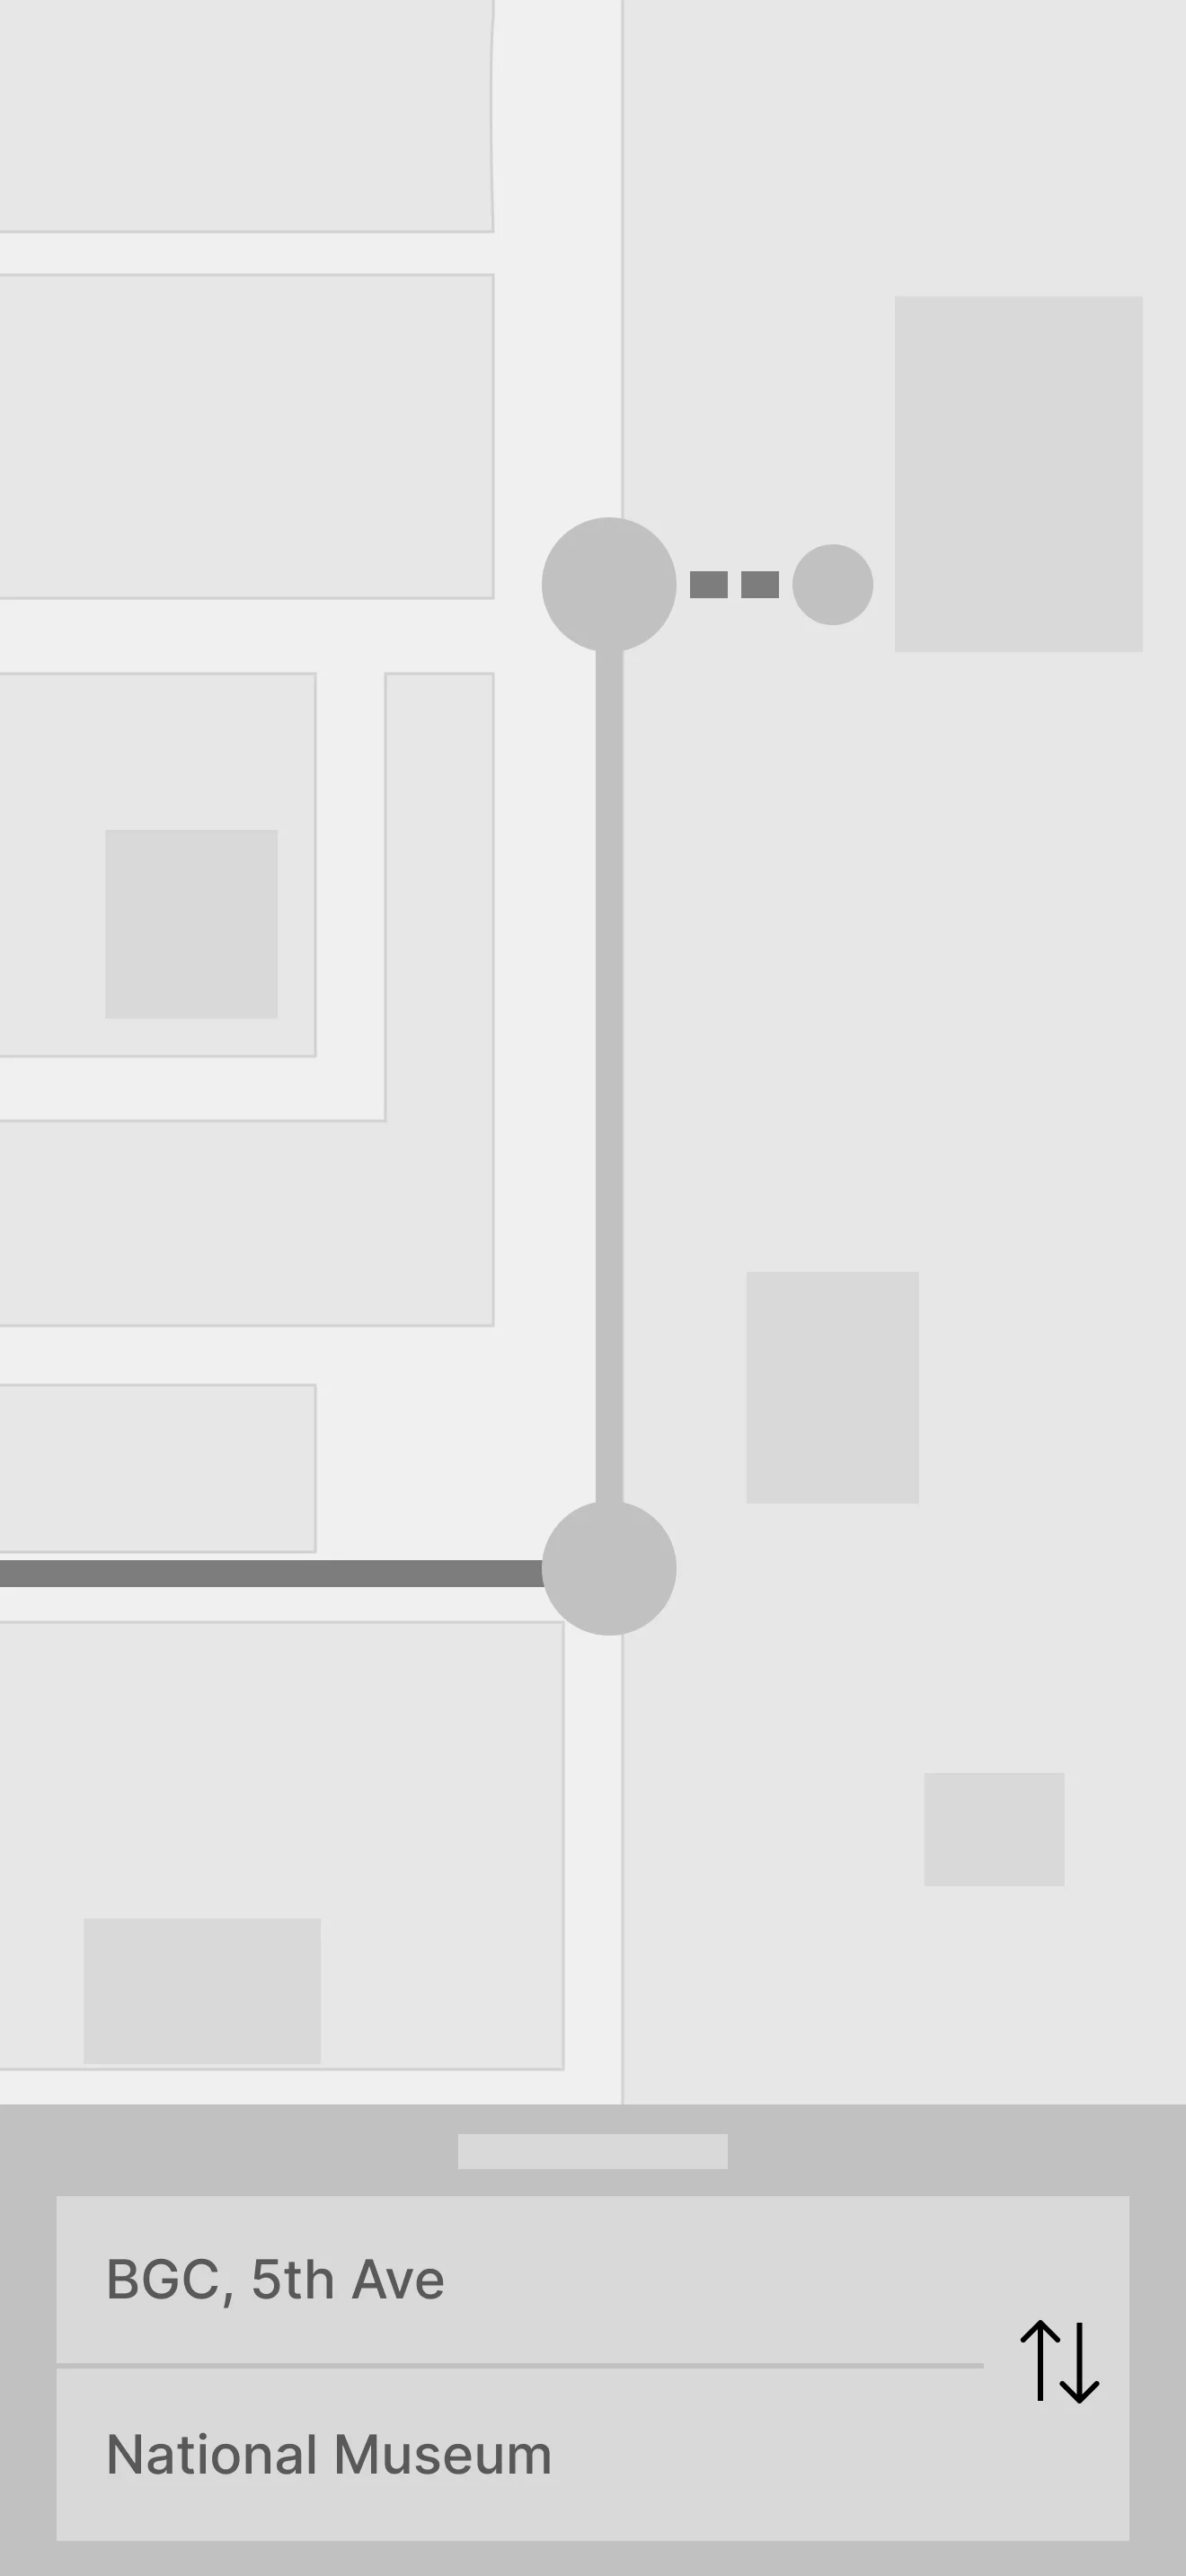
Screen
Route(Map)
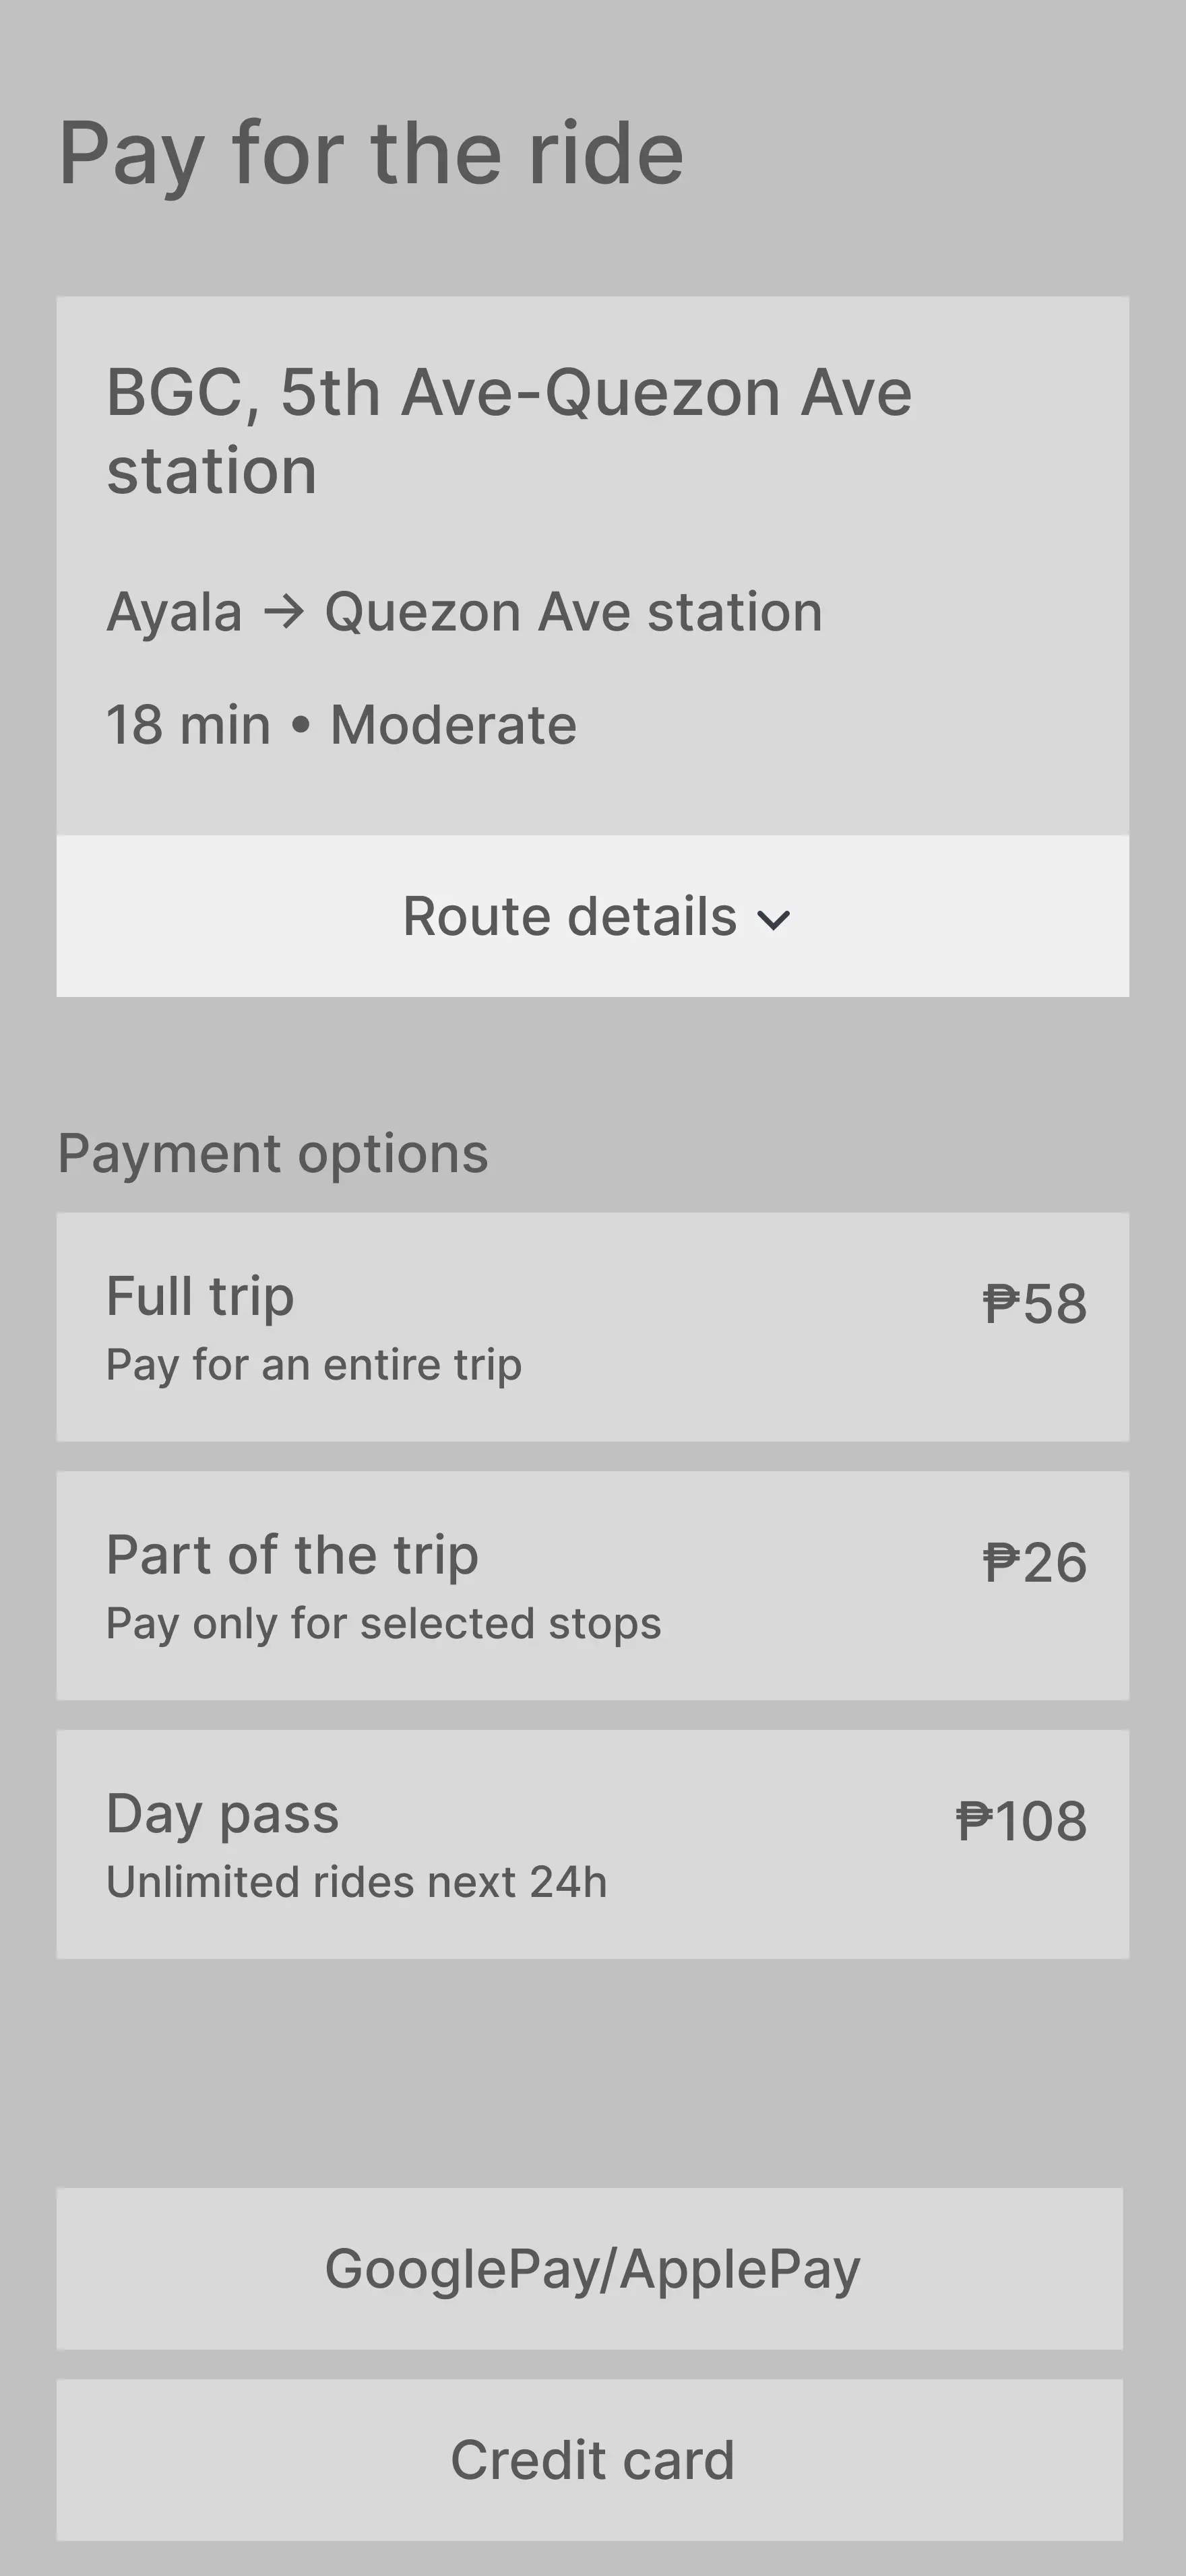
Screen
Buy tickets
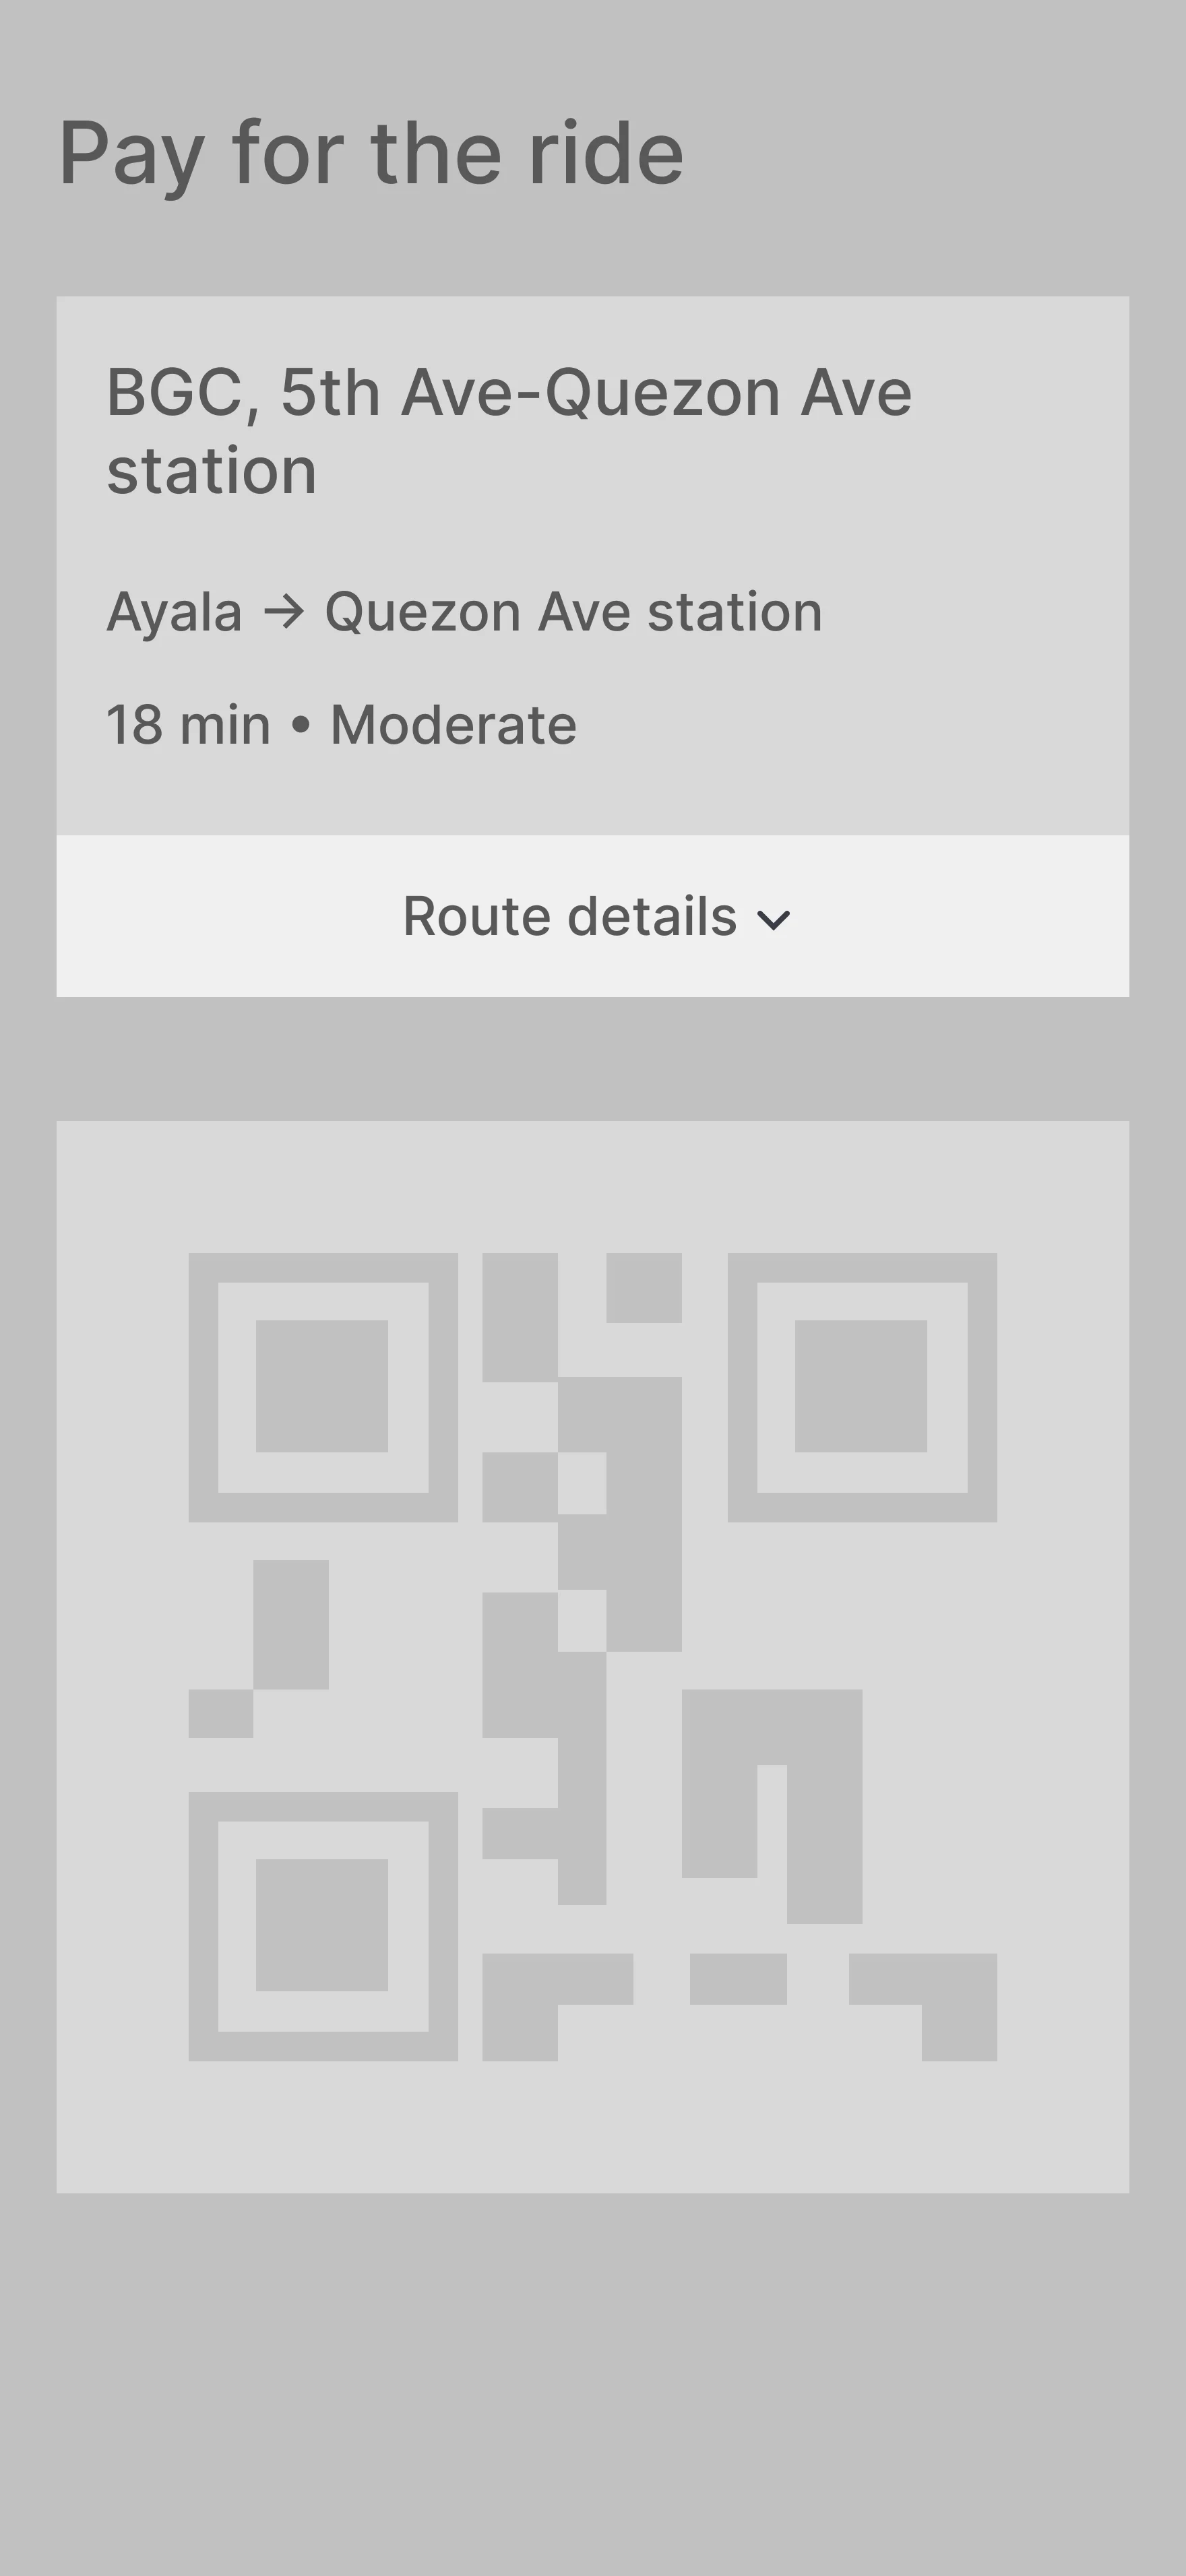
Screen
QR Ticket

Screen
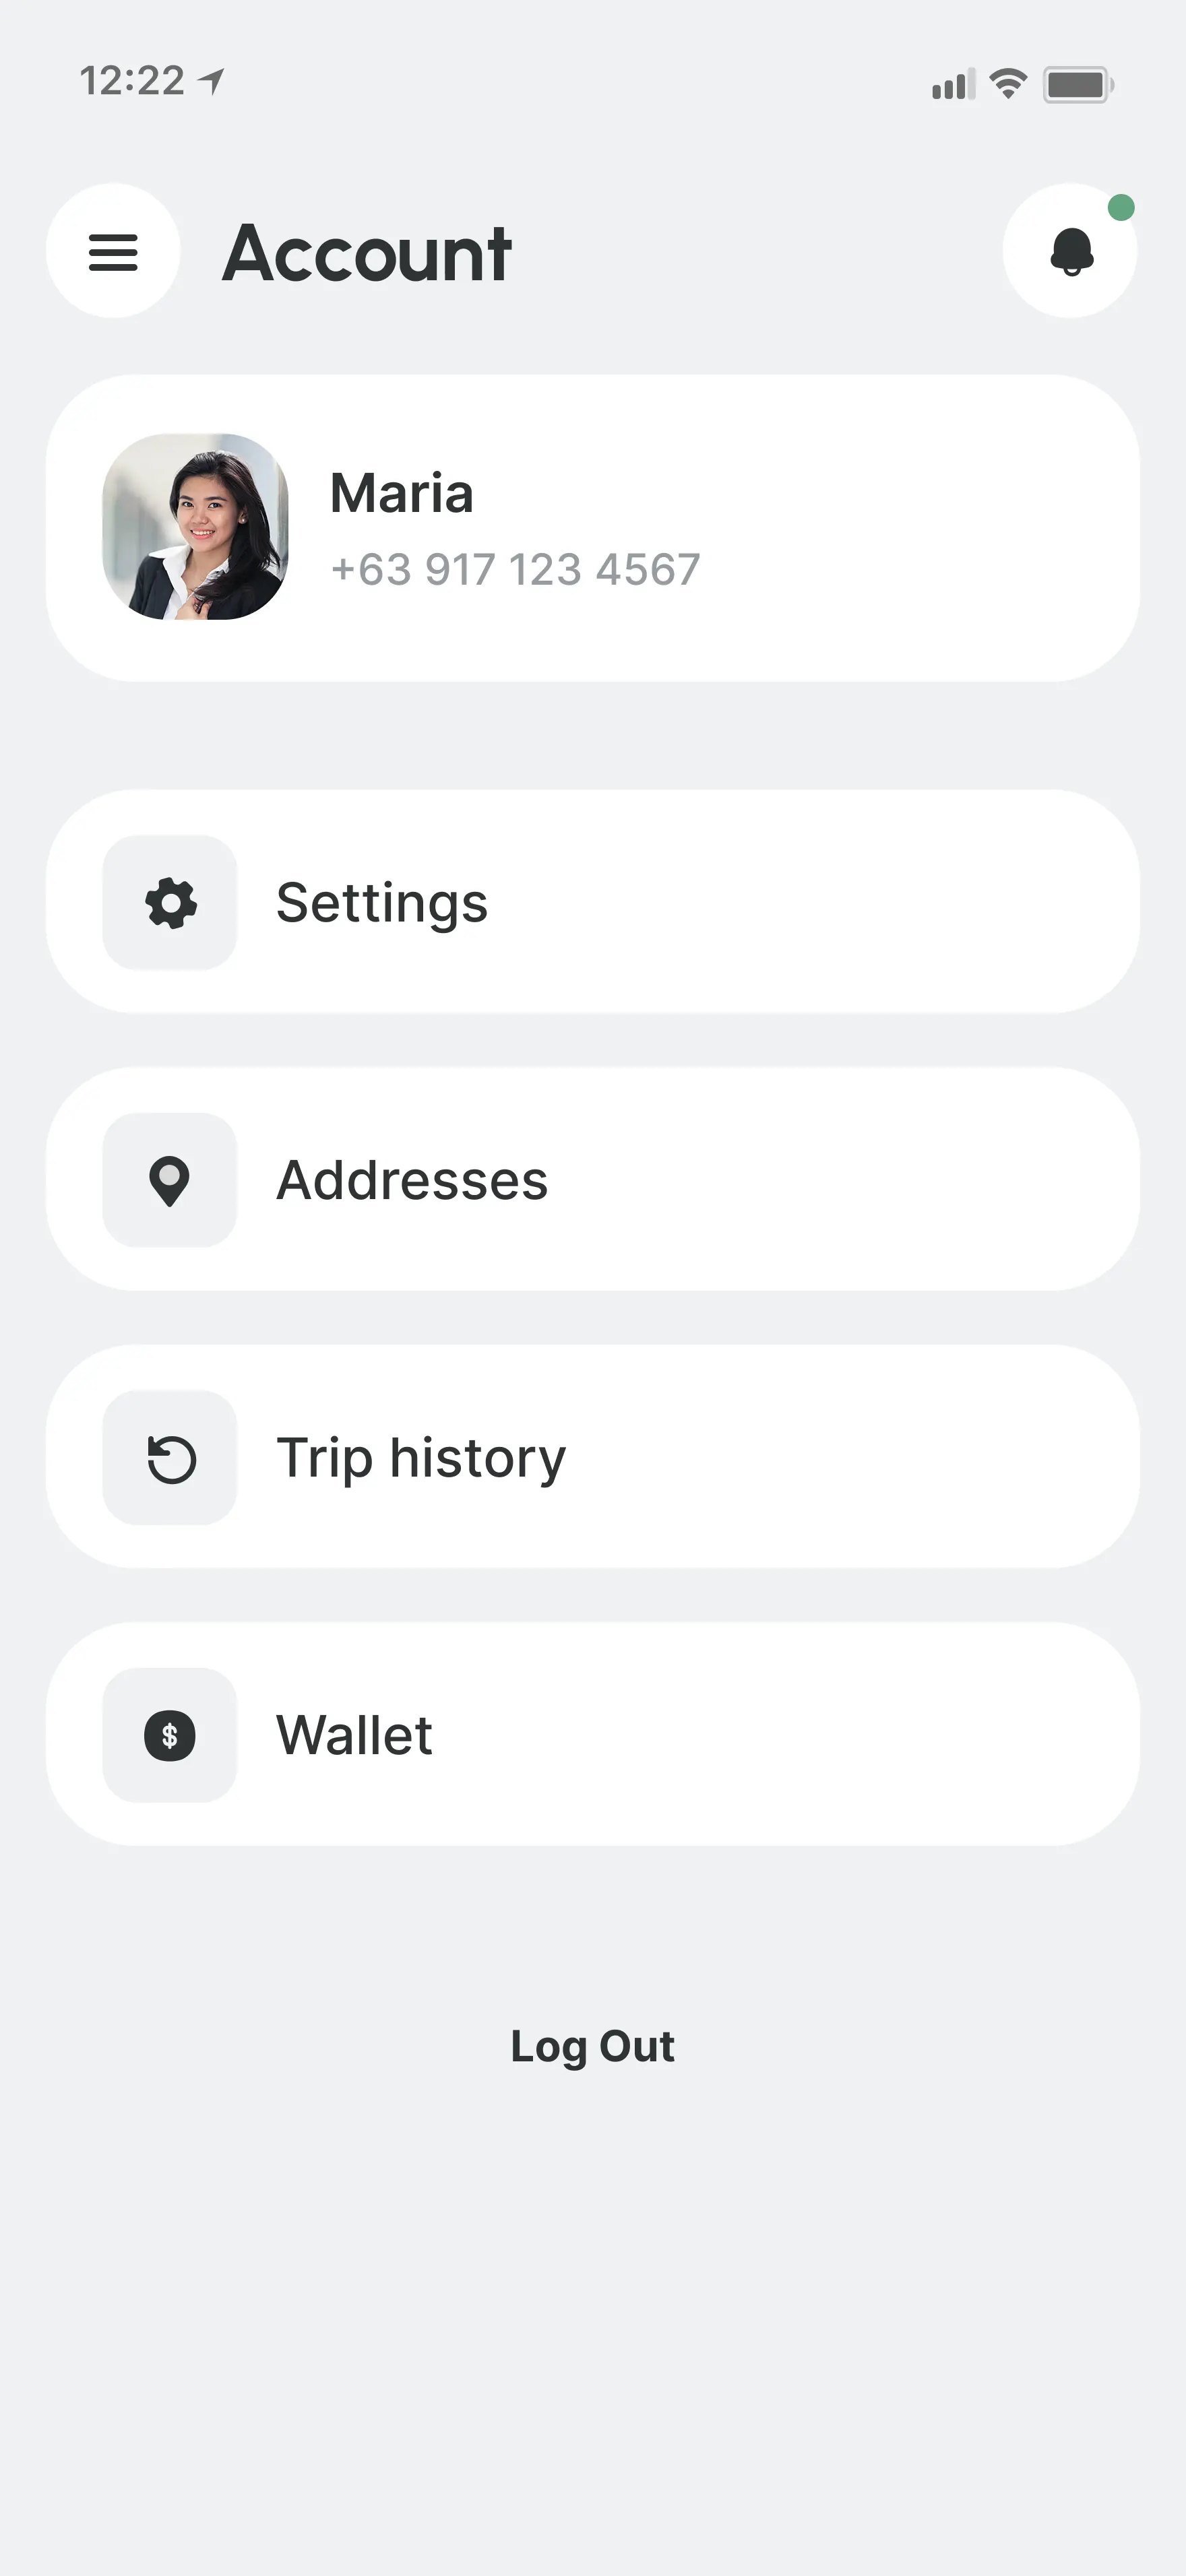
Account

Screen
Community accidents reporting
What I prioritized for MVP
For MVP, I prioritized the parts of the journey that reduce uncertainty fastest: one place to compare routes, clearer jeepney guidance, approximate fares, and real-time condition signals that help people decide whether a route is still worth taking.
I did not prioritize features that depended on infrastructure the city did not realistically have, such as precise live jeepney tracking or a unified payment flow across every transport mode. Those ideas sound valuable, but they would have made the product look more capable than it could actually be.
The goal of the first version was not to solve every transport problem in Manila. It was to help people make better decisions with the information that could be delivered credibly from day one.
Testing & Iteration
Five participants - two tourists, two new residents, one regular commuter - were given a single task: get from BGC to the National Museum.
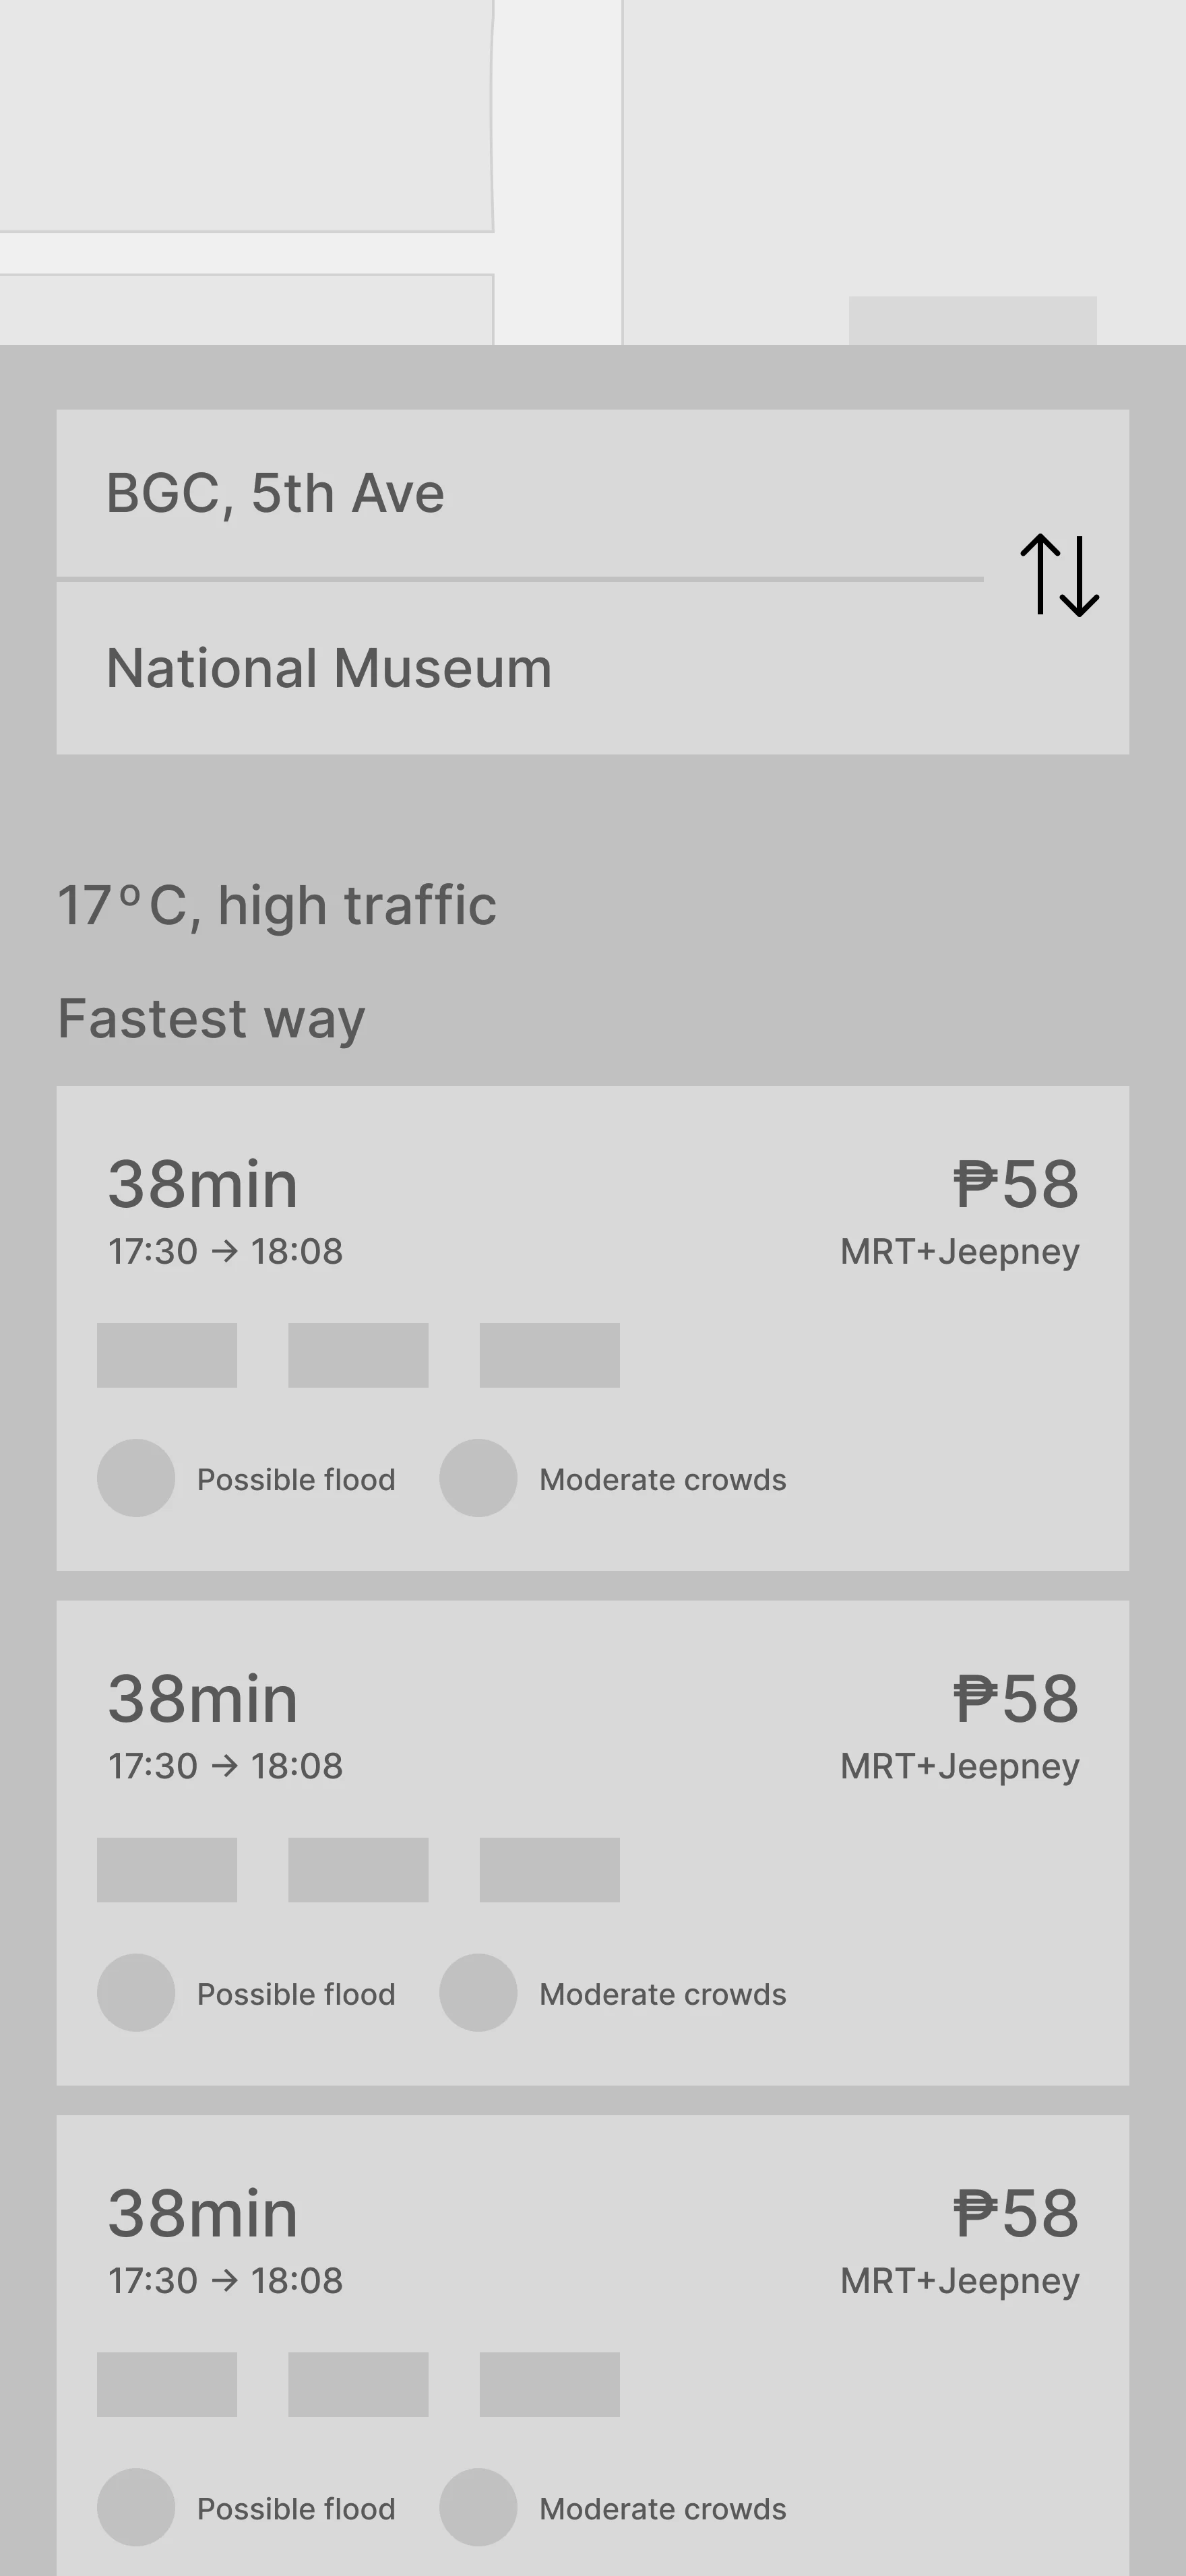
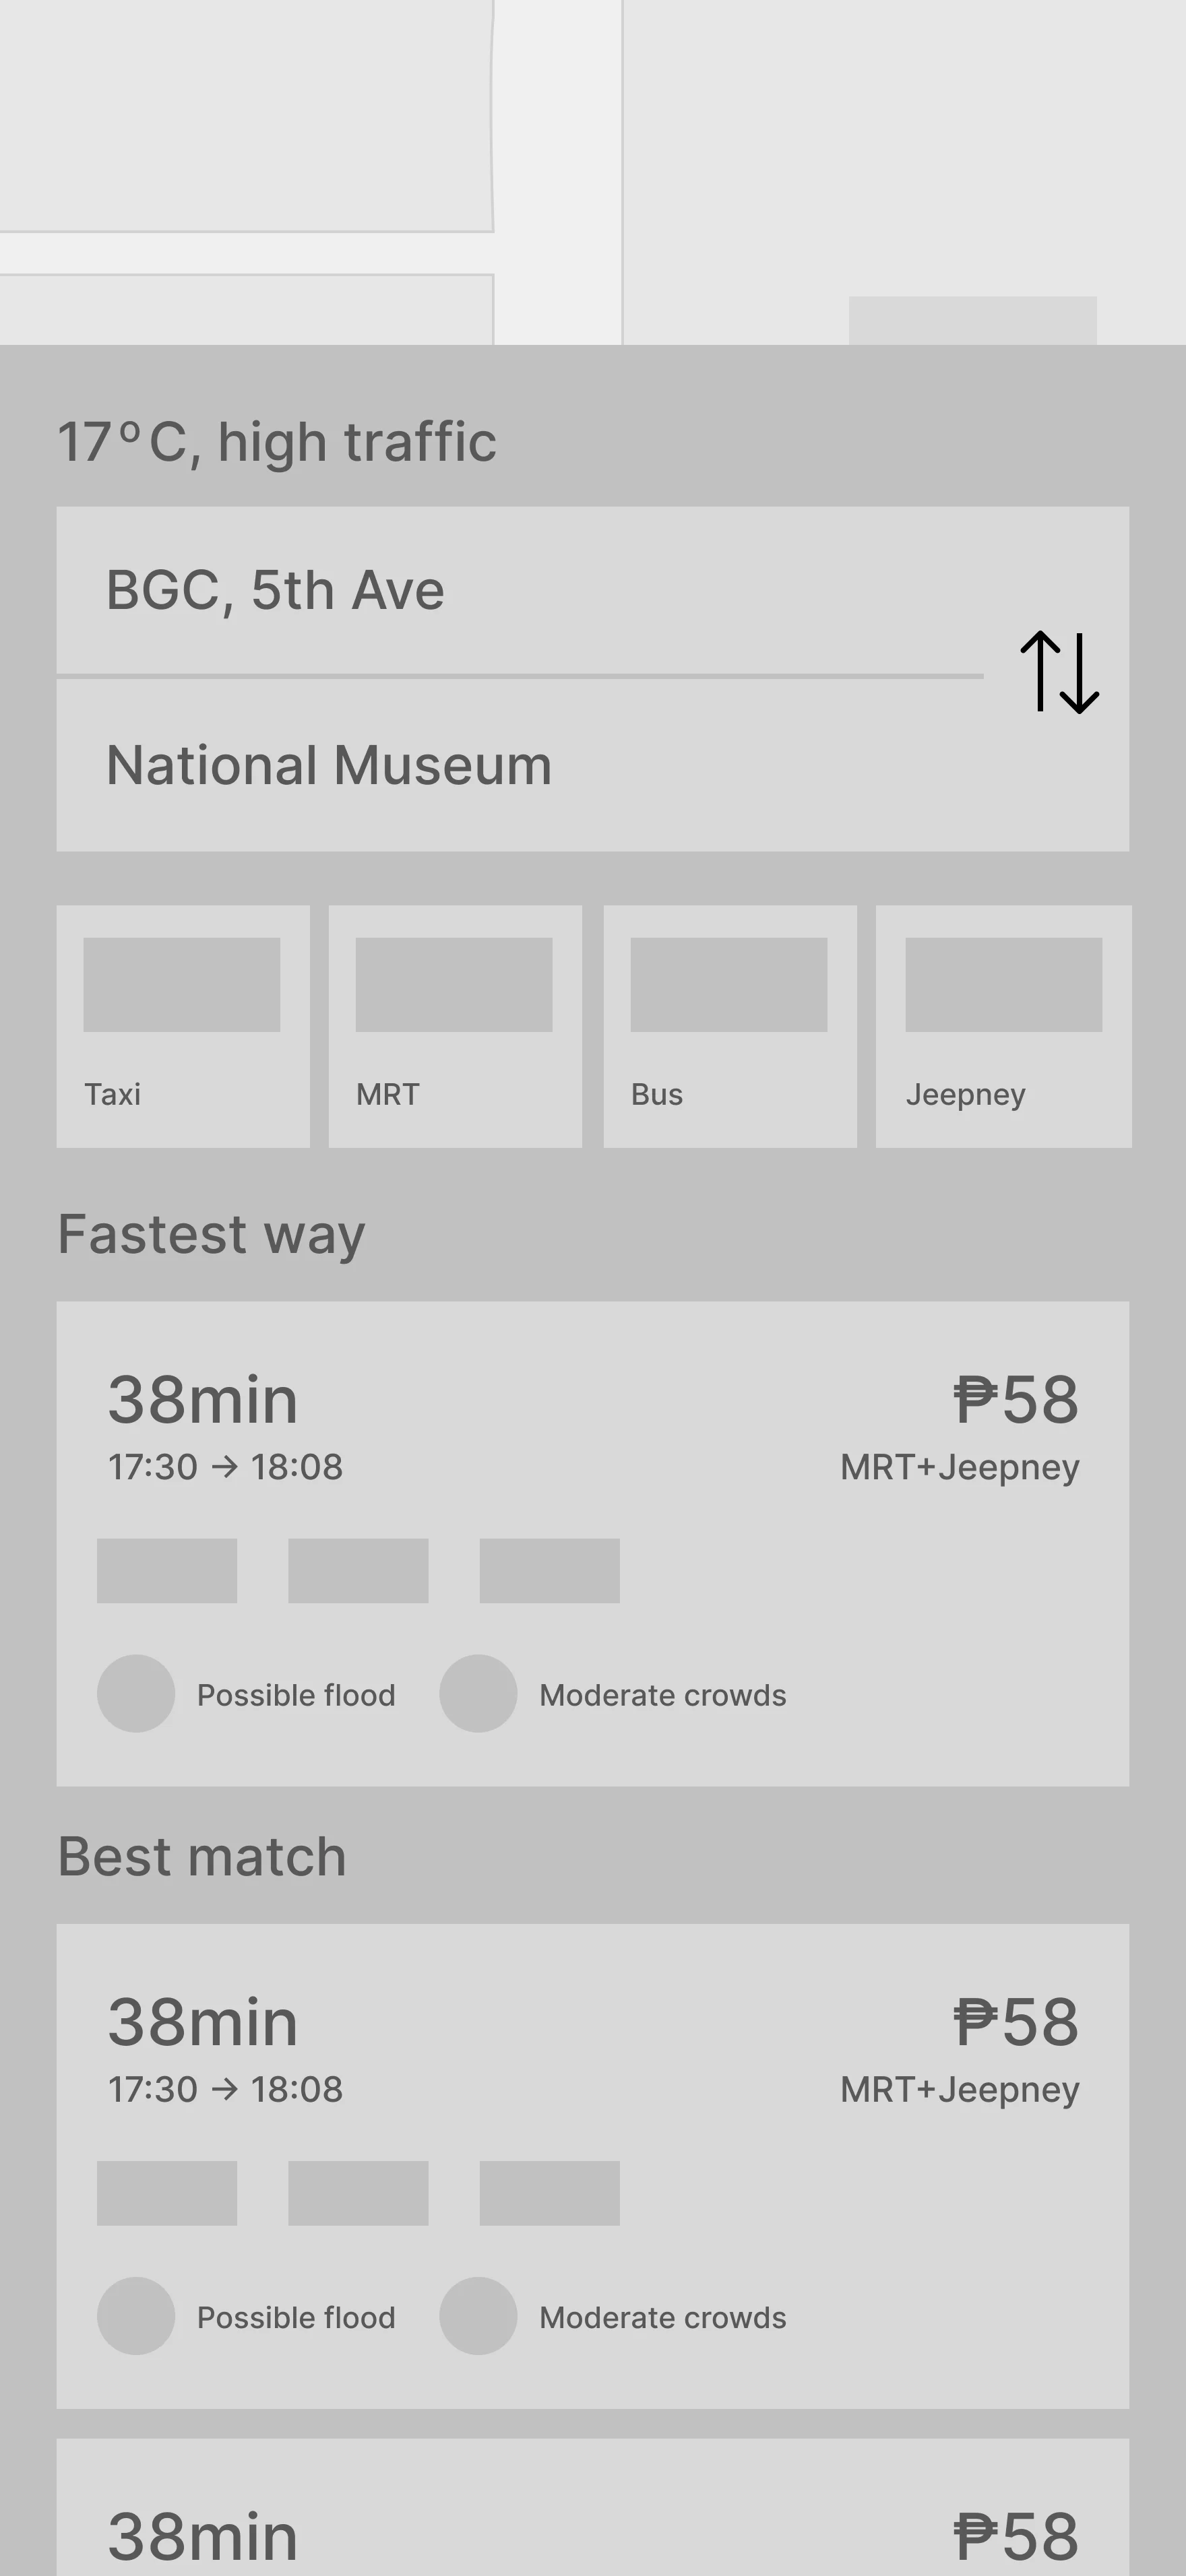
The first problem: Three out of five usersignored jeepney routes entirely, spending time mentally filtering out options they'd never consider rather than comparing real ones. The design had shown everything at once, assuming more options meant better decisions. It did the opposite. The fix was a transport mode filter upfront - users selected what they were comfortable with before seeing any routes. Decision time dropped from around two minutes to under thirty seconds. And unexpectedly, two participants who had filtered out jeepneys reconsidered after seeing the price difference. Giving users control early made them more open to unfamiliar options, not less.
Before
After
The second failure was the payment flow. Four out of five participants couldn't find their purchased ticket after buying it, and two arrived at the jeepney step expecting to tap a card - a false expectation the design had quietly created by not distinguishing between modes. The solution was to remove the separate tickets section entirely and surface payment exactly where it was needed: inline, at the moment of boarding. One tourist said the cash warning on the jeepney step prompted them to check their wallet before leaving. That was the behavior the whole feature was meant to produce.
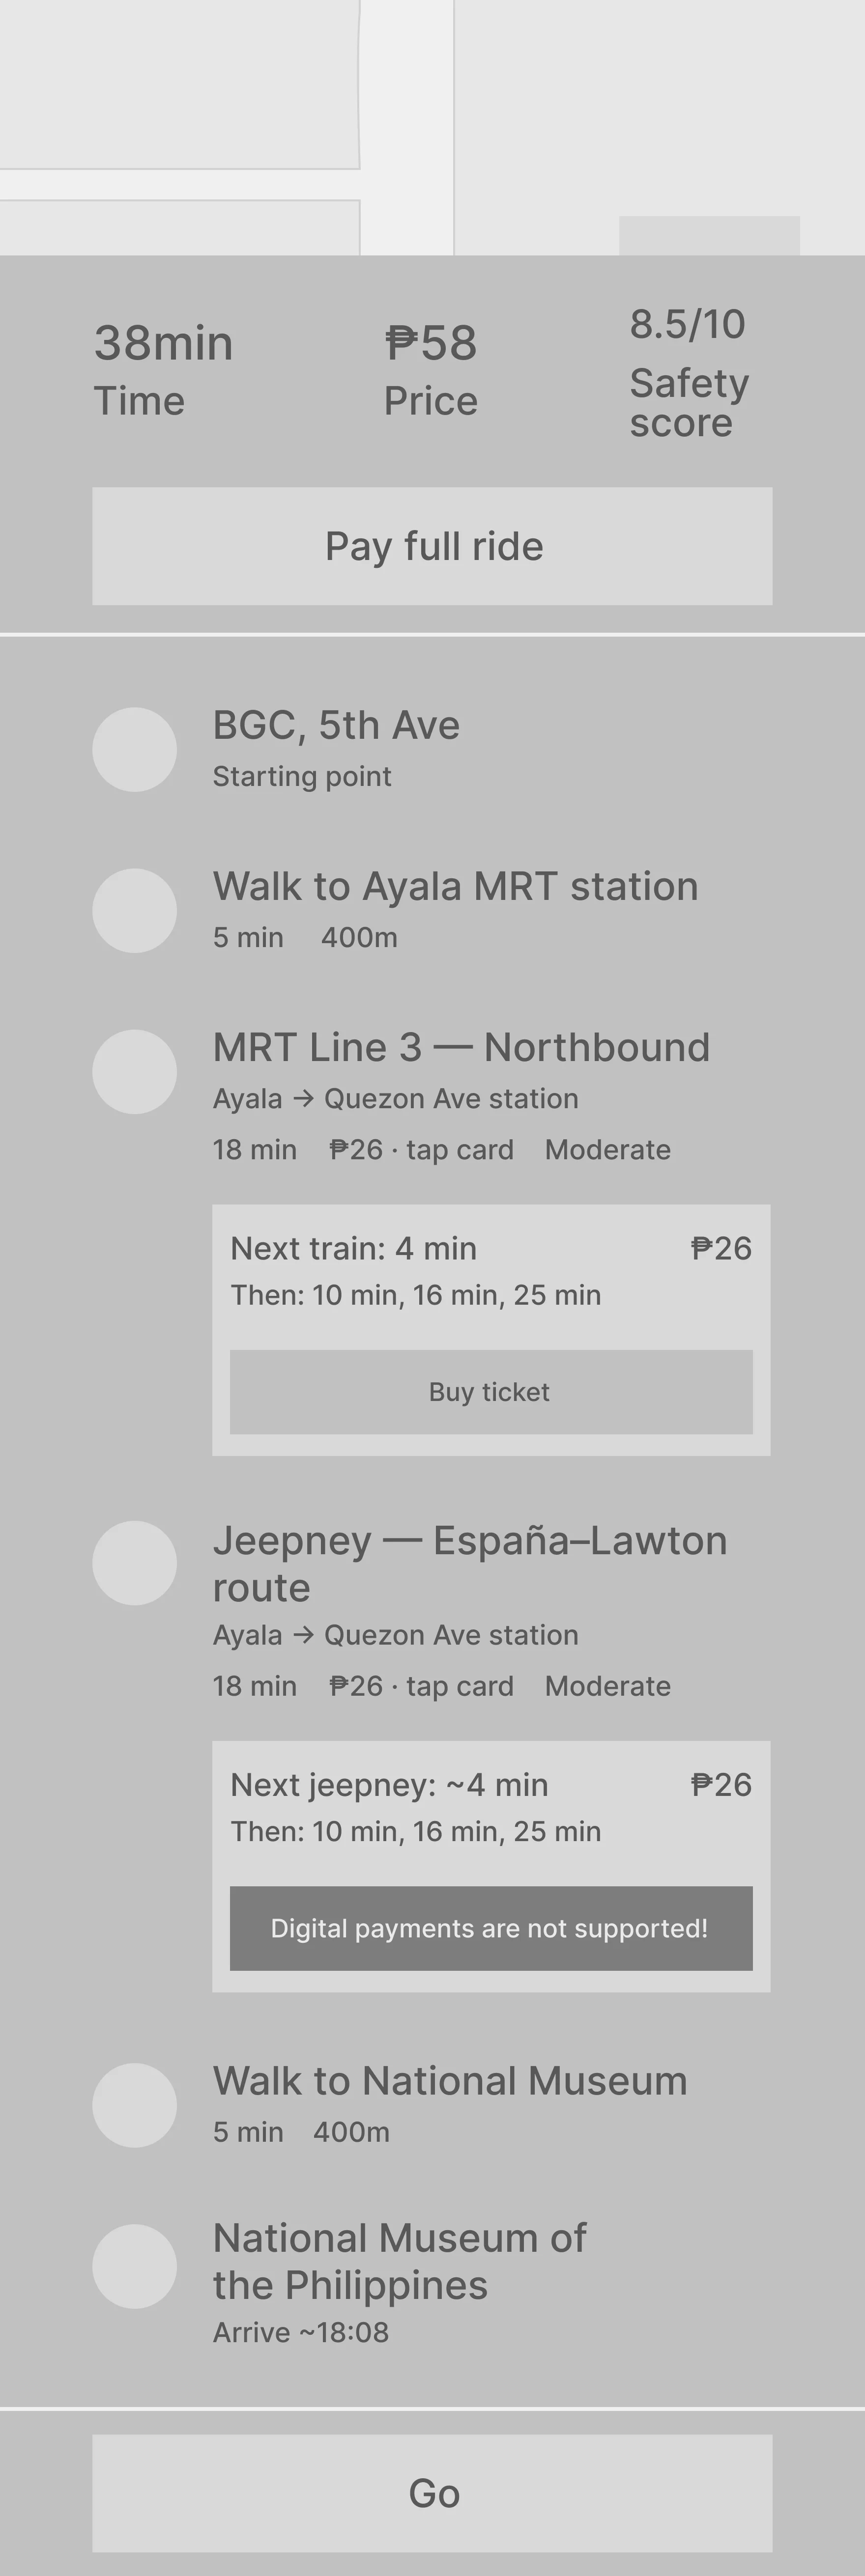
The third was the safety score. "8.5/10"generated responses ranging from "is this a crime rating?" to "does this mean the road is smooth?" Nobody interpreted it correctly without prompting. A number communicated precision without meaning. Replacing it with plain language - "generally safe", "use caution at night" - meant all five participants described it correctly without any explanation.
Two rounds of testing, three significant changes. In each case the solution wasn't adding more - it was replacing what didn't work with something users could actually act on.
After the testing of the final prototype with 5 original participants, the results were:
Task 1: Find a route from Makati to Intramuros using public transport.
Result: 5 out of 5 participants completed the task without assistance; based on observed session pacing during testing, the estimated average time to complete a full route from destination input to confirmed choice was under 2 minutes.
Task 2: Compare two route options and choose one.
Result: 5 out of 5 participants completed the task successfully.
The decision to replace the numeric safety score, for example 6.4/10, with plain-language labels, for example "Generally safe, stay alert", was driven by testing feedback showing the number confused more than it clarified. Projected outcome: plain-language labels are expected to show 30-40% higher comprehension accuracy compared to numeric scores, based on the qualitative pattern observed across participants during prototype testing.
Final design
Home page
The search-first layout is a direct response to the research finding that users arrive with a destination in mind, not with what transport they want to use.
.0cyrehmq9z6z8.webp)
Route details
The "Best match" label on one route card solves the decision fatigue problem without removing user agency.
"Digital payment are not supported" prepares users to take cash from home.
Possibility to pay for MRT without step of buying ticket.
.41bxumjg9r1x4.webp)
.010ab0t2r59zp.webp)
Community reporting
Tracking jeepneys with driver-side app gps tracking / showing location based o historical data.
Solving problem of impossibility of tracking road events by adding user reporting.
.31xgxybb0ayig.webp)
.3ybndazdbn178.webp)
Payment & wallet
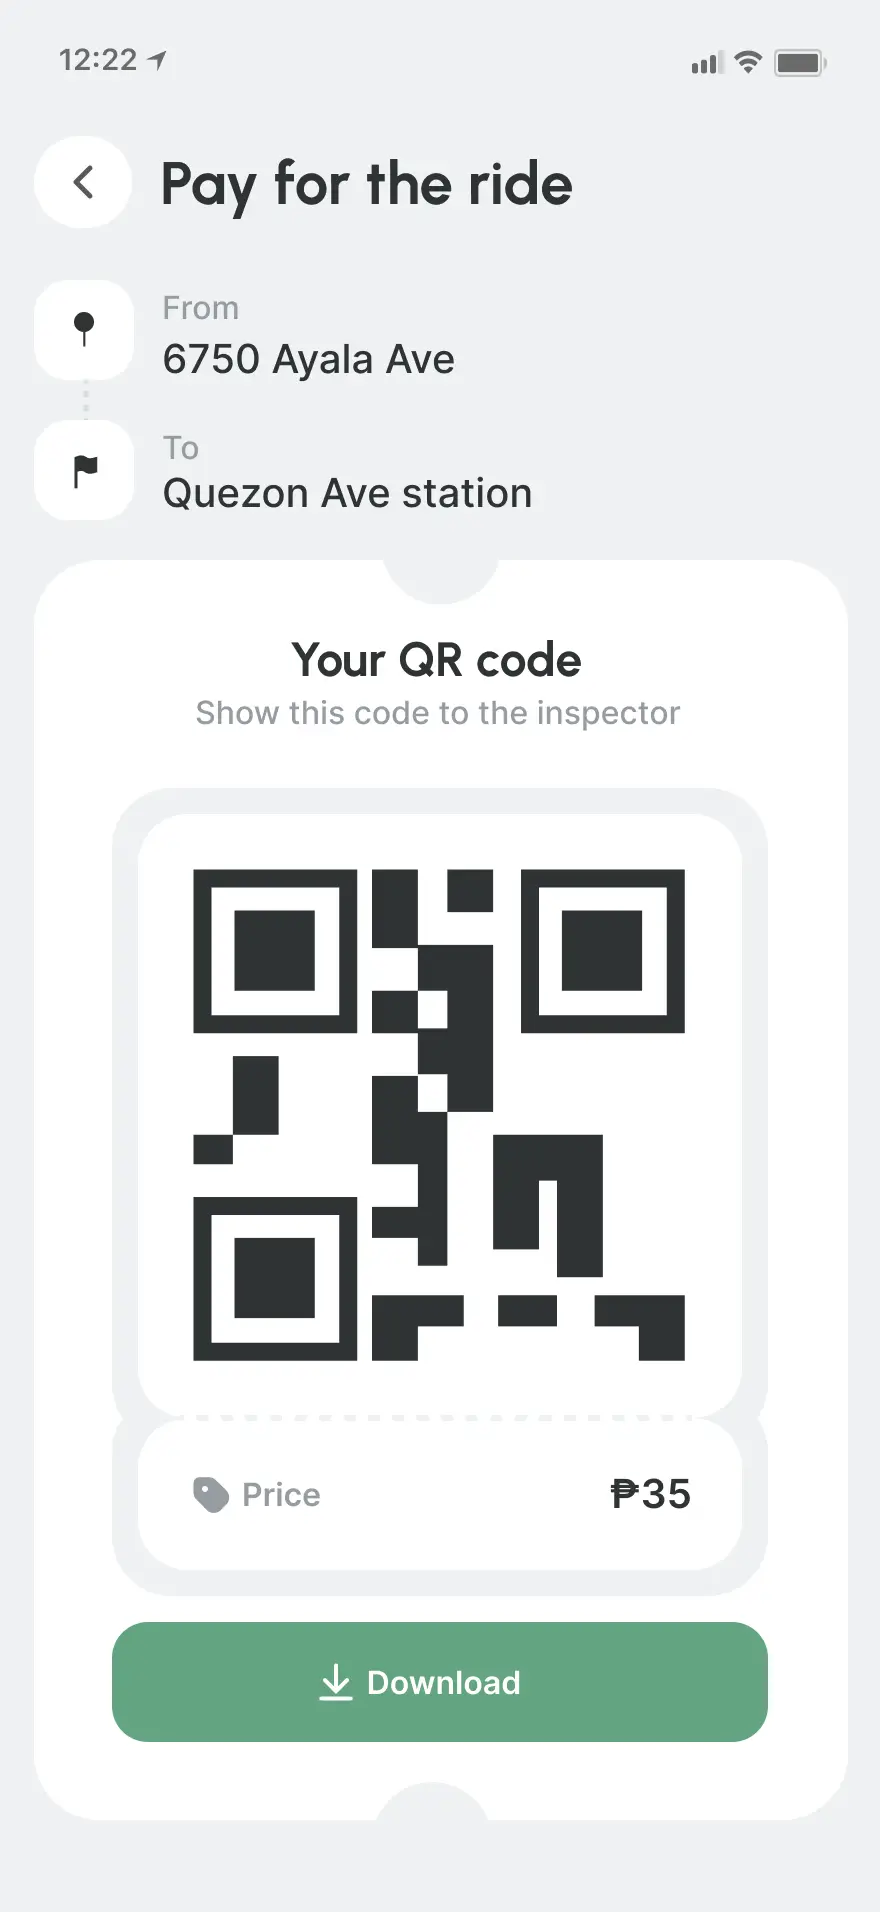
Instant payment between passengers and drivers with installed app.
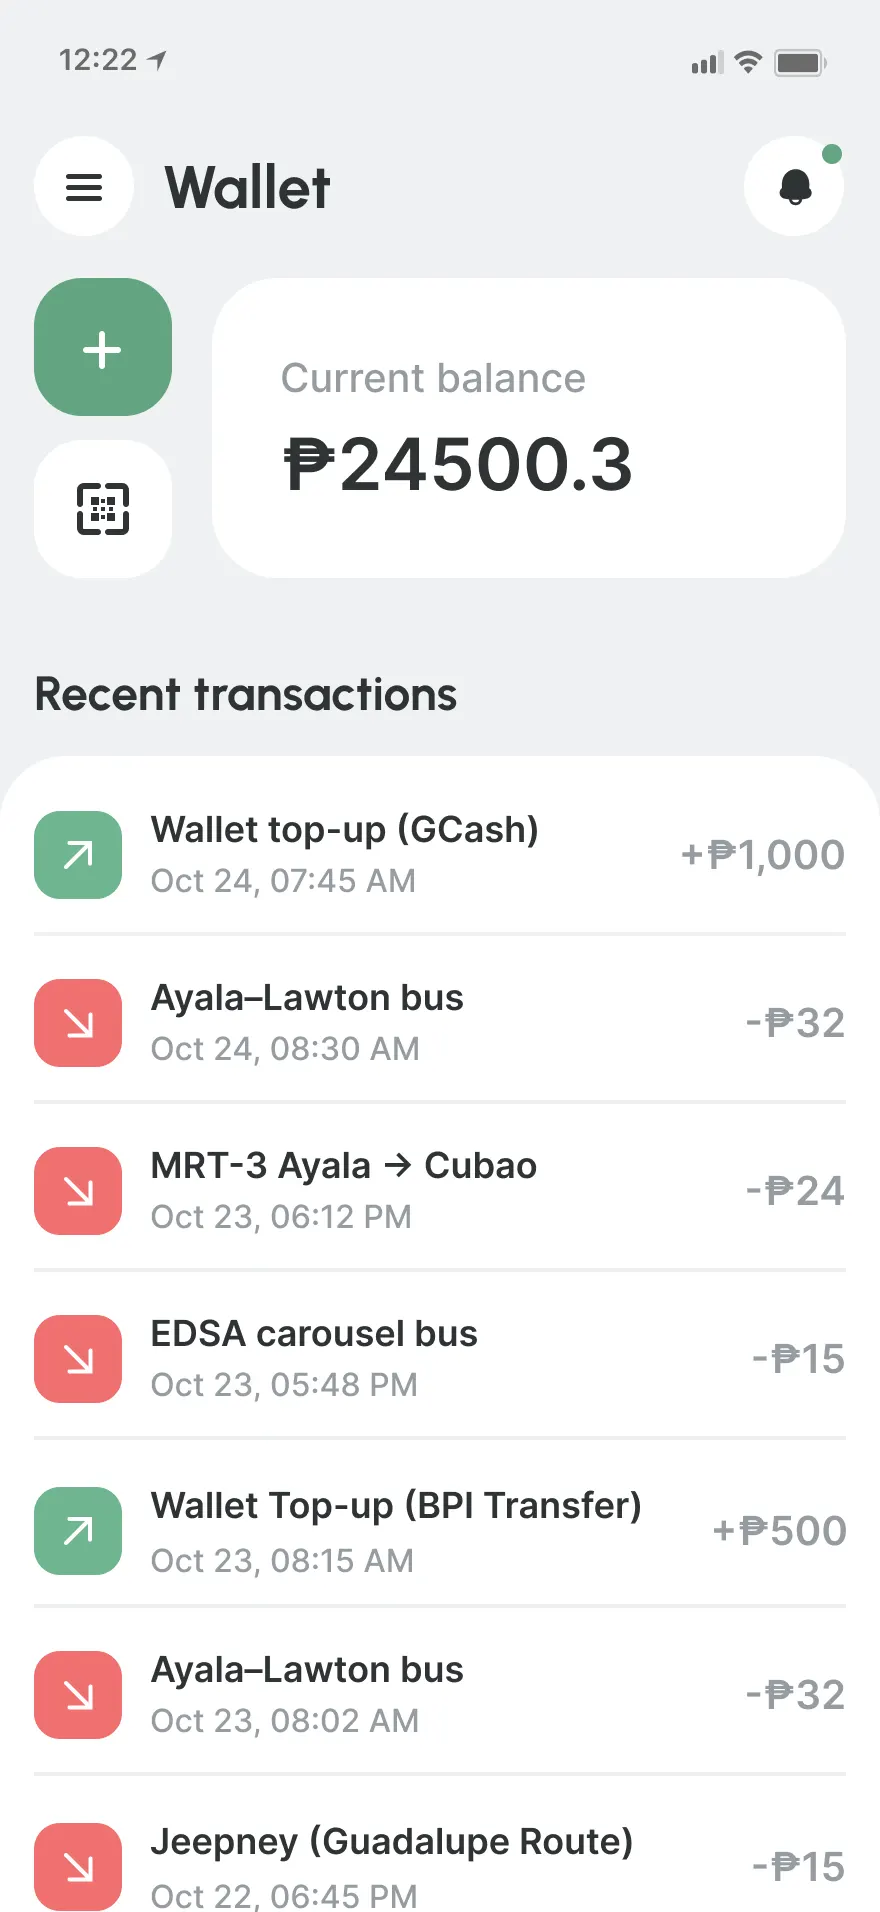
User account
Driver-side extension
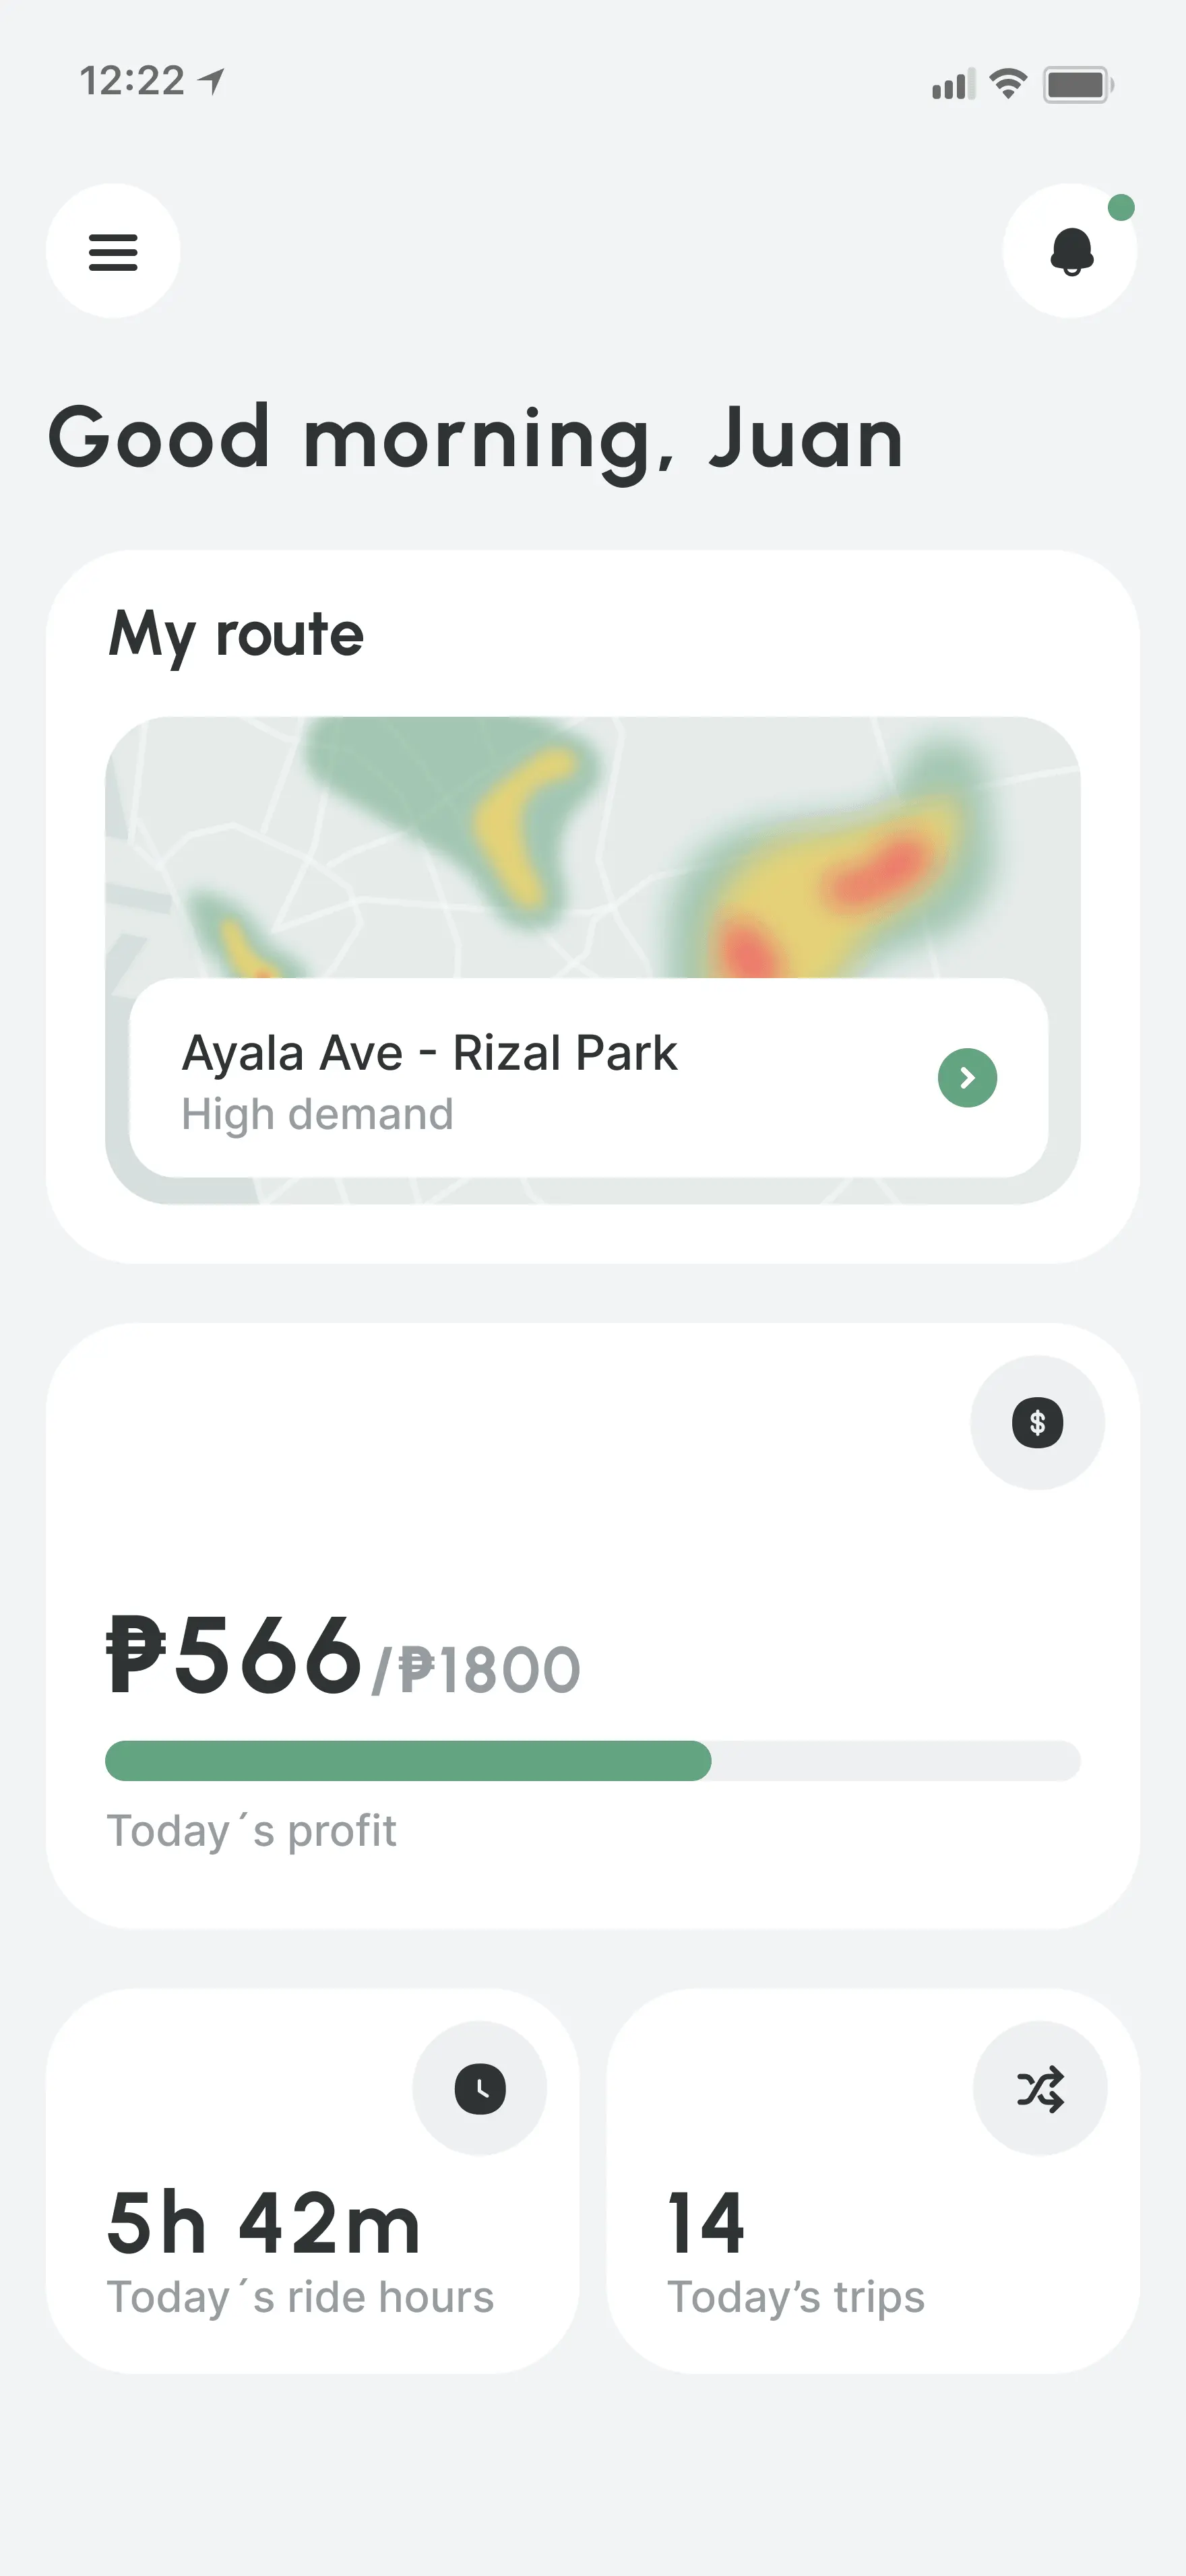
Driver's Side
Adding a driver-side system would make real-time jeepney tracking possible for commuters while helping drivers simplify daily decisions by knowing which route to choose based on demand.
Hypothesis
Introducing the system that supports commuters from the beginning to the end of their journey, and provides full reliable real-time information: from planning to arrival will allow them to travel with more confidence and make more informed decision on every step of the journey.
Research
Competitor analysis
Before turning the research into features, I looked at adjacent products to understand whether drivers already had access to the signals they needed. The goal was to see which tools supported real demand decisions, which ones only solved part of the problem, and whether any platform actually served traditional transport drivers in Manila.
| Grab Driver | Angkas / JoyRide | Waze Carpool | Sakay.ph | Moovit Operator Portal | |
|---|---|---|---|---|---|
| Primary users | TNVS / car drivers | Motorcycle drivers | Private car sharers | None (passenger-only) | Transit agencies |
| Demand heatmap | Yes | Basic zone coloring | No | No | No |
| Predictive demand | No | No | No | No | Limited (agency tools) |
| Driver supply visibility | No | No | No | No | No |
| Route registration | No | N/A | N/A | No driver tools | Yes (agency API) |
| Disruption alerts | Limited (surge notifications) | No | Waze hazard reports | No | No |
| Earnings tracker | Yes - trip history | Yes - basic | No | No | No |
| Passenger app integration | Full (Grab is both) | Full | Full | Passenger only | Passenger only |
| Jeepney / UV support | No | No | No | Route data only | No |
| Offline capability | No | No | No | No | No |
| Pre-shift market overview | No | No | No | No | No |
The comparison made the gap very clear. Existing platforms either optimize private and ride-hailing drivers, or support passengers without giving drivers usable decision tools.
No product combined demand visibility, supply awareness, disruption context, and support for jeepney or UV drivers in a way that could guide real route decisions before or during a shift.
Observation sessions
Three field observations made the research tangible. In the morning, Romeo, a jeepney owner-operator on the Espana-Lawton route, arrived early but still had no reliable way to judge demand. He watched other drivers leave, made small route decisions based on conversation and instinct, left half-empty, manually tracked cash in a notebook, and ended the shift unsure whether he had made the right calls or simply wasted fuel.
In the afternoon, Manny and Berto, a bus driver and conductor pair, were dealing with a different version of the same problem. Traffic stretched a normal trip far beyond expectation, passenger counts were tracked manually, and decisions about stopping or passing riders were made reactively. The conductor could feel crowding building but had no structured way to communicate it forward, which meant the route kept operating on word-of-mouth instead of usable data.
By evening, Carlos, a UV driver, was moving between popular pickup spots almost entirely on gut feeling. He compared notes with other drivers, relied on observation rather than any platform, and accepted suboptimal rides because there was no visibility into which areas were actually worth waiting in. Across all three sessions, the pattern was consistent: demand decisions were made in an information vacuum, and that uncertainty translated directly into financial risk.
Findings
Drivers have almost no real-time visibility into passenger demand. They operate somewhere between pure guesswork and delayed tribal knowledge, while Grab drivers see live demand heatmaps. Traditional transport drivers compete blind.
Experienced drivers have built sophisticated mental models and informal networks to compensate, but that knowledge takes years to acquire, does not scale to new drivers, is not accessible to passengers, and breaks down during disruptions.
Fixed daily costs such as boundary payments and fuel turn every quiet hour into a financial risk. Without knowing whether demand will improve, decisions about waiting, leaving, or repositioning become binary and anxiety-driven.
Jeepneys, buses, and UVs are systematically invisible in the digital tools passengers use to navigate Manila. Drivers lose passengers not because the vehicle is worse, but because the system is illegible and hard to discover.
There is no mechanism to match supply and demand between stops. Drivers, conductors, stops, and passengers all operate in isolation, which leads to empty return trips in one direction while people wait in the other.
Disruptions such as events, weather, protests, and road closures are learned too late, usually through passengers or direct observation. By the time drivers know, the opportunity to prepare or reposition has already passed.
Drivers make both tactical decisions, like whether to continue a shift, and strategic ones, like which route or vehicle to operate, without comparative data. High-stakes choices with direct earnings impact are made blind.
User interviews
I conducted interviews with four traditional transport workers: two jeepney drivers, one bus driver, and one bus conductor.
The conversations focused on how they read demand, what signals they trusted, and how they made stop, route, and shift decisions when reliable data was missing.
The pattern was consistent: most decisions were made through instinct, delayed word-of-mouth, or experience built up over years rather than structured information.
What emerged was not just a usability problem, but an information asymmetry problem. Drivers needed visibility into demand, crowding, and timing in the same way commuters needed visibility into routes and stops.
Romeo
Jeepney driver
I want to see where passengers are actively waiting along my route, so I don't run empty sections when I could reroute slightly to pick them up.
“
Rodrigo
Jeepney driver
I want to know expected passenger demand after rush hour so I can avoid wasting fuel searching for riders.
“
Manny
Bus driver
I want visibility into crowd levels along my route so I can better prepare for passenger volume.
“
Berto
Bus conductor
I want to know if passenger demand is increasing ahead so we can manage stop decisions better.
“
From Research to Features
Key moments from research translated directly into product decisions.
Observation
A driver arrives at the terminal with fuel already spent and watches other drivers leave just to guess whether demand is worth it.
→
Insight
Pre-shift information matters more than mid-shift information because it changes the most expensive decision of the day: whether to drive at all.
→
Design decision
Pre-shift demand forecast for the driver's route with high / medium / low demand and the best start window, labeled clearly as estimated.
Observation
During a mid-morning slowdown, a driver cannot tell whether passengers have stopped because of traffic or because demand has dropped.
→
Insight
Traffic slowdown and demand drop feel identical from the driver's seat, but they require opposite responses. Without that distinction, drivers default to inaction.
→
Design decision
Demand diagnosis card triggered at the moment of slowdown by correlating time-of-day patterns with traffic data.
Observation
A driver earns PHP 100 over four dead afternoon hours while needing PHP 1,800 to break even. Leaving feels like giving up, but staying burns fuel.
→
Insight
Drivers need permission to stop, backed by data that frames stopping as strategy rather than failure.
→
Design decision
Demand timeline for the rest of the day with a boundary progress tracker, so stopping is framed as optimizing, not quitting.
Observation
At the end of a 14-hour shift, a driver is still short of boundary and keeps driving even when the net return is already negative.
→
Insight
Financial desperation overrides safety when the cost of continuing is invisible and the potential earnings remain visible.
→
Design decision
End-of-shift recommendation when earnings per hour drop below fuel cost, with the net loss shown plainly and compared against starting fresh tomorrow.
Observation
A driver often learns about a post-event crowd surge only after physically seeing it, by which point other vehicles have already captured the demand.
→
Insight
Event-based surges are predictable, but no system translates public event schedules into driver positioning guidance.
→
Design decision
Event alert 60-90 minutes before nearby events end, paired with a specific positioning suggestion sourced from public event listings.
Constraints
Extremely low tech literacy. The driver interface cannot require more than 2-3 taps to reach any critical information.
One-handed use while parked. Drivers often check phones with the engine running while eating or drinking, so every interaction has to be fast and readable at a glance.
Fixed route franchise structure. Most jeepney drivers cannot freely reroute, so the system can support micro-adjustments and stop prioritization, but not full route changes outside the legal corridor.
What Surprised Me
Drivers already improvise sophisticated workarounds despite zero system support. Miguel, for example, combines four different data sources, which showed me how much latent capability is being wasted.
Drivers know exactly why they lose to Grab. They understand that invisibility in digital systems is the issue, but they feel powerless to change it.
The PHP 1,800 daily boundary forces blind decision-making under financial pressure. It is not just a cost structure; it shapes behavior.
Drivers want supply visibility almost as much as demand visibility. Knowing where other vehicles are clustered matters because it changes whether waiting is smart or wasteful.
Event disruptions are learned reactively from passengers, not proactively through alerts, which means opportunities are lost before drivers can act.
Pain Points
No visibility into where passengers are waiting, so route and stop decisions are forced into guesswork.
No way to track what makes money, which means drivers cannot learn from past shifts or optimize behavior.
Passengers cannot find jeepneys digitally and default to Grab before the first interaction even happens.
Drivers learn about flooding, events, and road closures from passengers instead of alerts.
Conductors cannot tell stops ahead that a bus is already full.
Drivers do not know where other drivers are, which leads to inefficient clustering.
Vehicles return empty while passengers wait in the opposite direction.
The Problem
Drivers operating traditional transport in Manila compete blind while ride-hailing platforms dominate through information asymmetry.
Without visibility into passenger demand, real-time conditions, or supply dynamics, drivers make navigational and strategic decisions based on guessing, tribal knowledge, and incomplete information. The result is wasted fuel, missed earnings, and an inability to compete with platforms like Grab that already provide demand signals.
This is not a missing technology problem. It is a missing decision-support layer for the drivers who need it most.
Persona
Romeo
Age: 52
Jeepney owner-operator
Occupation: Traditional transport driver
Route: Route: Espana-Lawton
About
Romeo has spent 15 years operating the Espana-Lawton route. He owns his jeepney, paid it off 8 years ago, and now earns roughly PHP 250-400 a day, down from about PHP 1,250 before the crisis. He finished high school, is largely self-taught, supports his wife and 3 adult children, and uses a basic Android phone with limited confidence.
Quote
"I know this route well, but every day still starts with the same question: is it worth burning fuel today if I don't know where the passengers will be?"
Motivations
Maximize daily earnings to support his family and cover remaining debts
Reduce fuel waste on empty runs
Adapt to demand changes instead of guessing
Compete with Grab without becoming invisible
Keep the jeepney profitable before it becomes too old to run
Needs
Pre-shift demand forecast before leaving home
Real-time passenger demand map
Next-trip demand prediction after drop-off
Simple earnings tracker showing passengers, fare, fuel, and net
Digital visibility so passengers can find the route and boarding point
Tips on fuel-efficient positioning
Goals
Increase average daily earnings from PHP 300 to PHP 550-650
Reduce fuel waste by 20% through smarter positioning
Make route decisions feel informed rather than guessed
Attract young passengers and tourists through digital visibility
Pain points
Wakes up anxious and unsure whether driving will be worth the fuel
Sits at stops with empty seats and no demand visibility
Sees tourists get into Grab without ever trying his route
Cannot explain unpredictable earnings to his family
Feels left behind by modernization and platform-driven transport
Does not trust most apps and worries about tracking or hidden costs
Driver's Journey Map
Mapping Romeo's full day showed that the hardest decisions were not operational in the usual sense. They were moments where financial pressure replaced information and forced him to act on instinct.
| Action | Thoughts / emotions | Pain points | Opportunities / Features | |
|---|---|---|---|---|
| Planning (5:30 AM) | Wakes up, checks the weather by looking outside, and defaults to his usual route. | "Should I drive Espana again? I'll just follow habit." 😐 | No demand data, no route comparison, and yesterday's result does not predict today. | Pre-shift demand forecast and route recommendation based on expected demand. |
| Checking the information | Gets fuel and asks other drivers whether the route is busy. | "Everyone's guessing too." 🤔 | Other drivers are equally unsure, and 10 minutes of conversation still produces no reliable signal. | Driver network intel showing how routes are performing today. |
| Arriving at terminal | Parks at the usual stop and waits for the first passenger. | "I hope demand is good." 🙂 | No confirmation that the route is right, and idle time already costs fuel. | Live demand gauge and route confidence indicator. |
| Waiting for passengers | Sits idle, drinks coffee, and watches the stop stay quiet. | "Is demand coming, or is this a bad day?" 🤔 | Dead time creates anxiety, and there is no way to tell whether the slowdown is temporary. | Wait-time estimate and demand trend indicator. |
| Morning rush | Demand picks up and the route performs well. | "Good choice. Keep going." 😌 | Busy periods hide optimization opportunities because there is no comparative route view. | Hourly earnings tracker and comparative route performance. |
| Slowdown and afternoon | Traffic rises, passengers thin out, and he earns very little over several hours. | "Should I switch, stay, or go home?" 😟 😣 | Cannot distinguish traffic from demand decline, and leaving feels like giving up while staying burns fuel. | Demand diagnosis card, demand timeline, and earnings forecast for staying vs. stopping. |
| Decision point | Considers whether to stop, continue, or push into the evening. | "I'm tired, but I still need money." 😮💨 | The decision is emotional instead of rational because there is no comparative data or healthy stopping point. | Risk-reward analysis with clear scenarios and a recommendation. |
| Evening peak | Demand surges again and earnings improve. | "This is the payoff." 🤩 | He still does not know the exact peak window or which stops are most valuable during it. | Peak optimization alerts and stop guidance. |
| Late evening / night | Keeps driving while exhausted even though returns are collapsing. | "Were these last rides worth the risk?" 😫 | Safety risk rises while net earnings can fall below fuel cost, but desperation hides the true cost of continuing. | Safety override, end-of-shift recommendation, and a plain comparison between going home now and starting fresh tomorrow. |
Solution
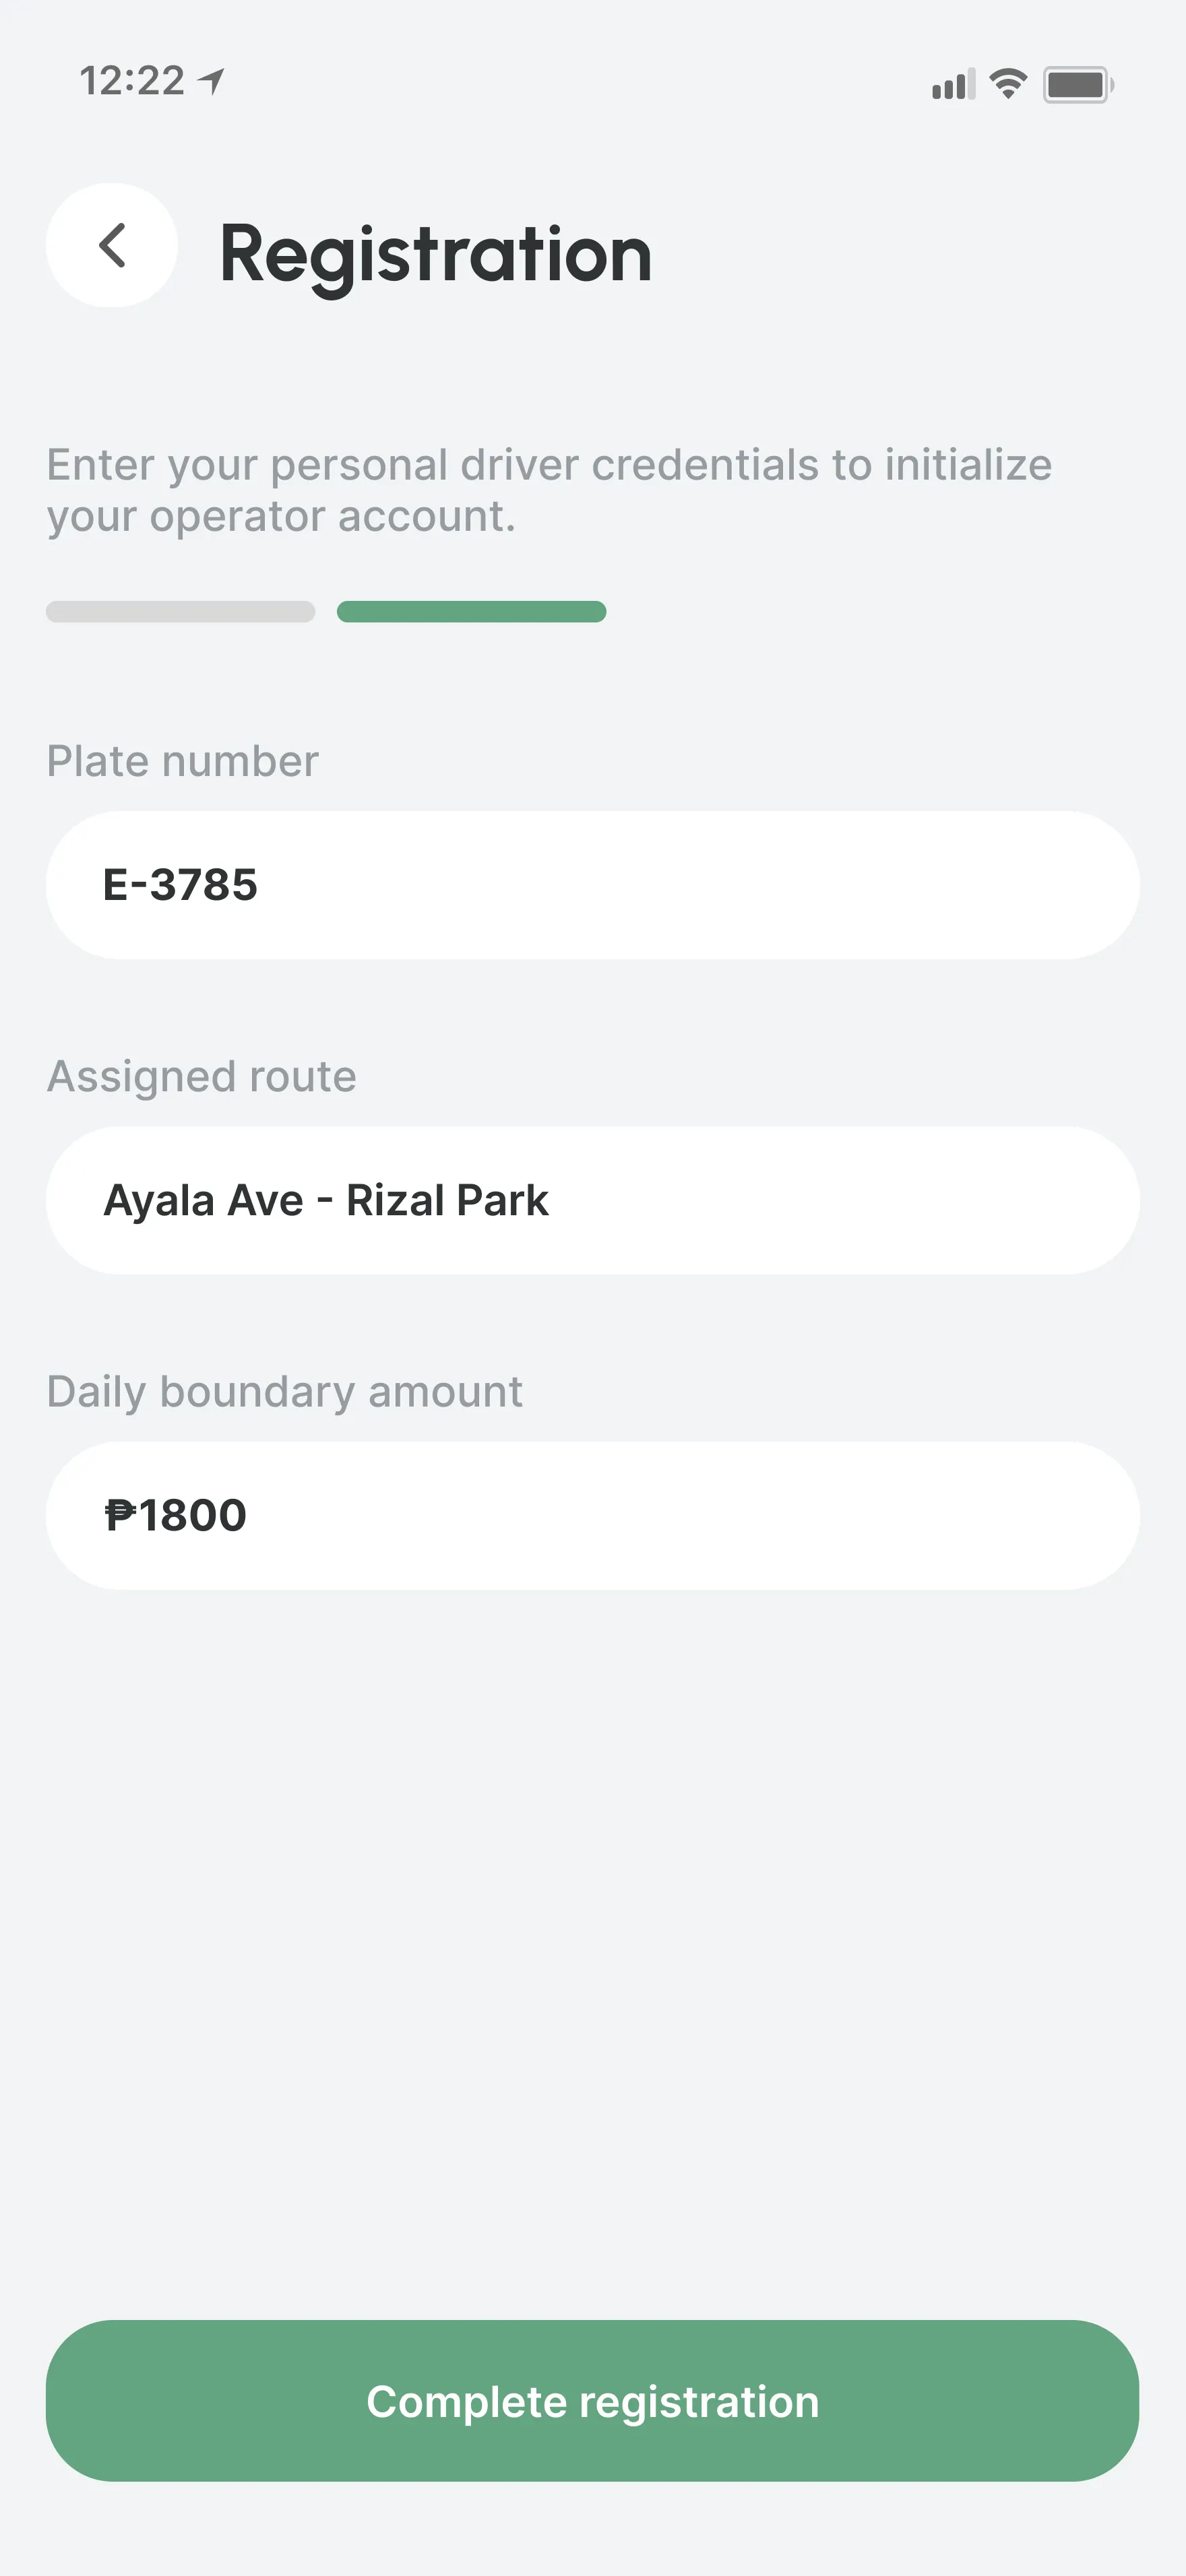
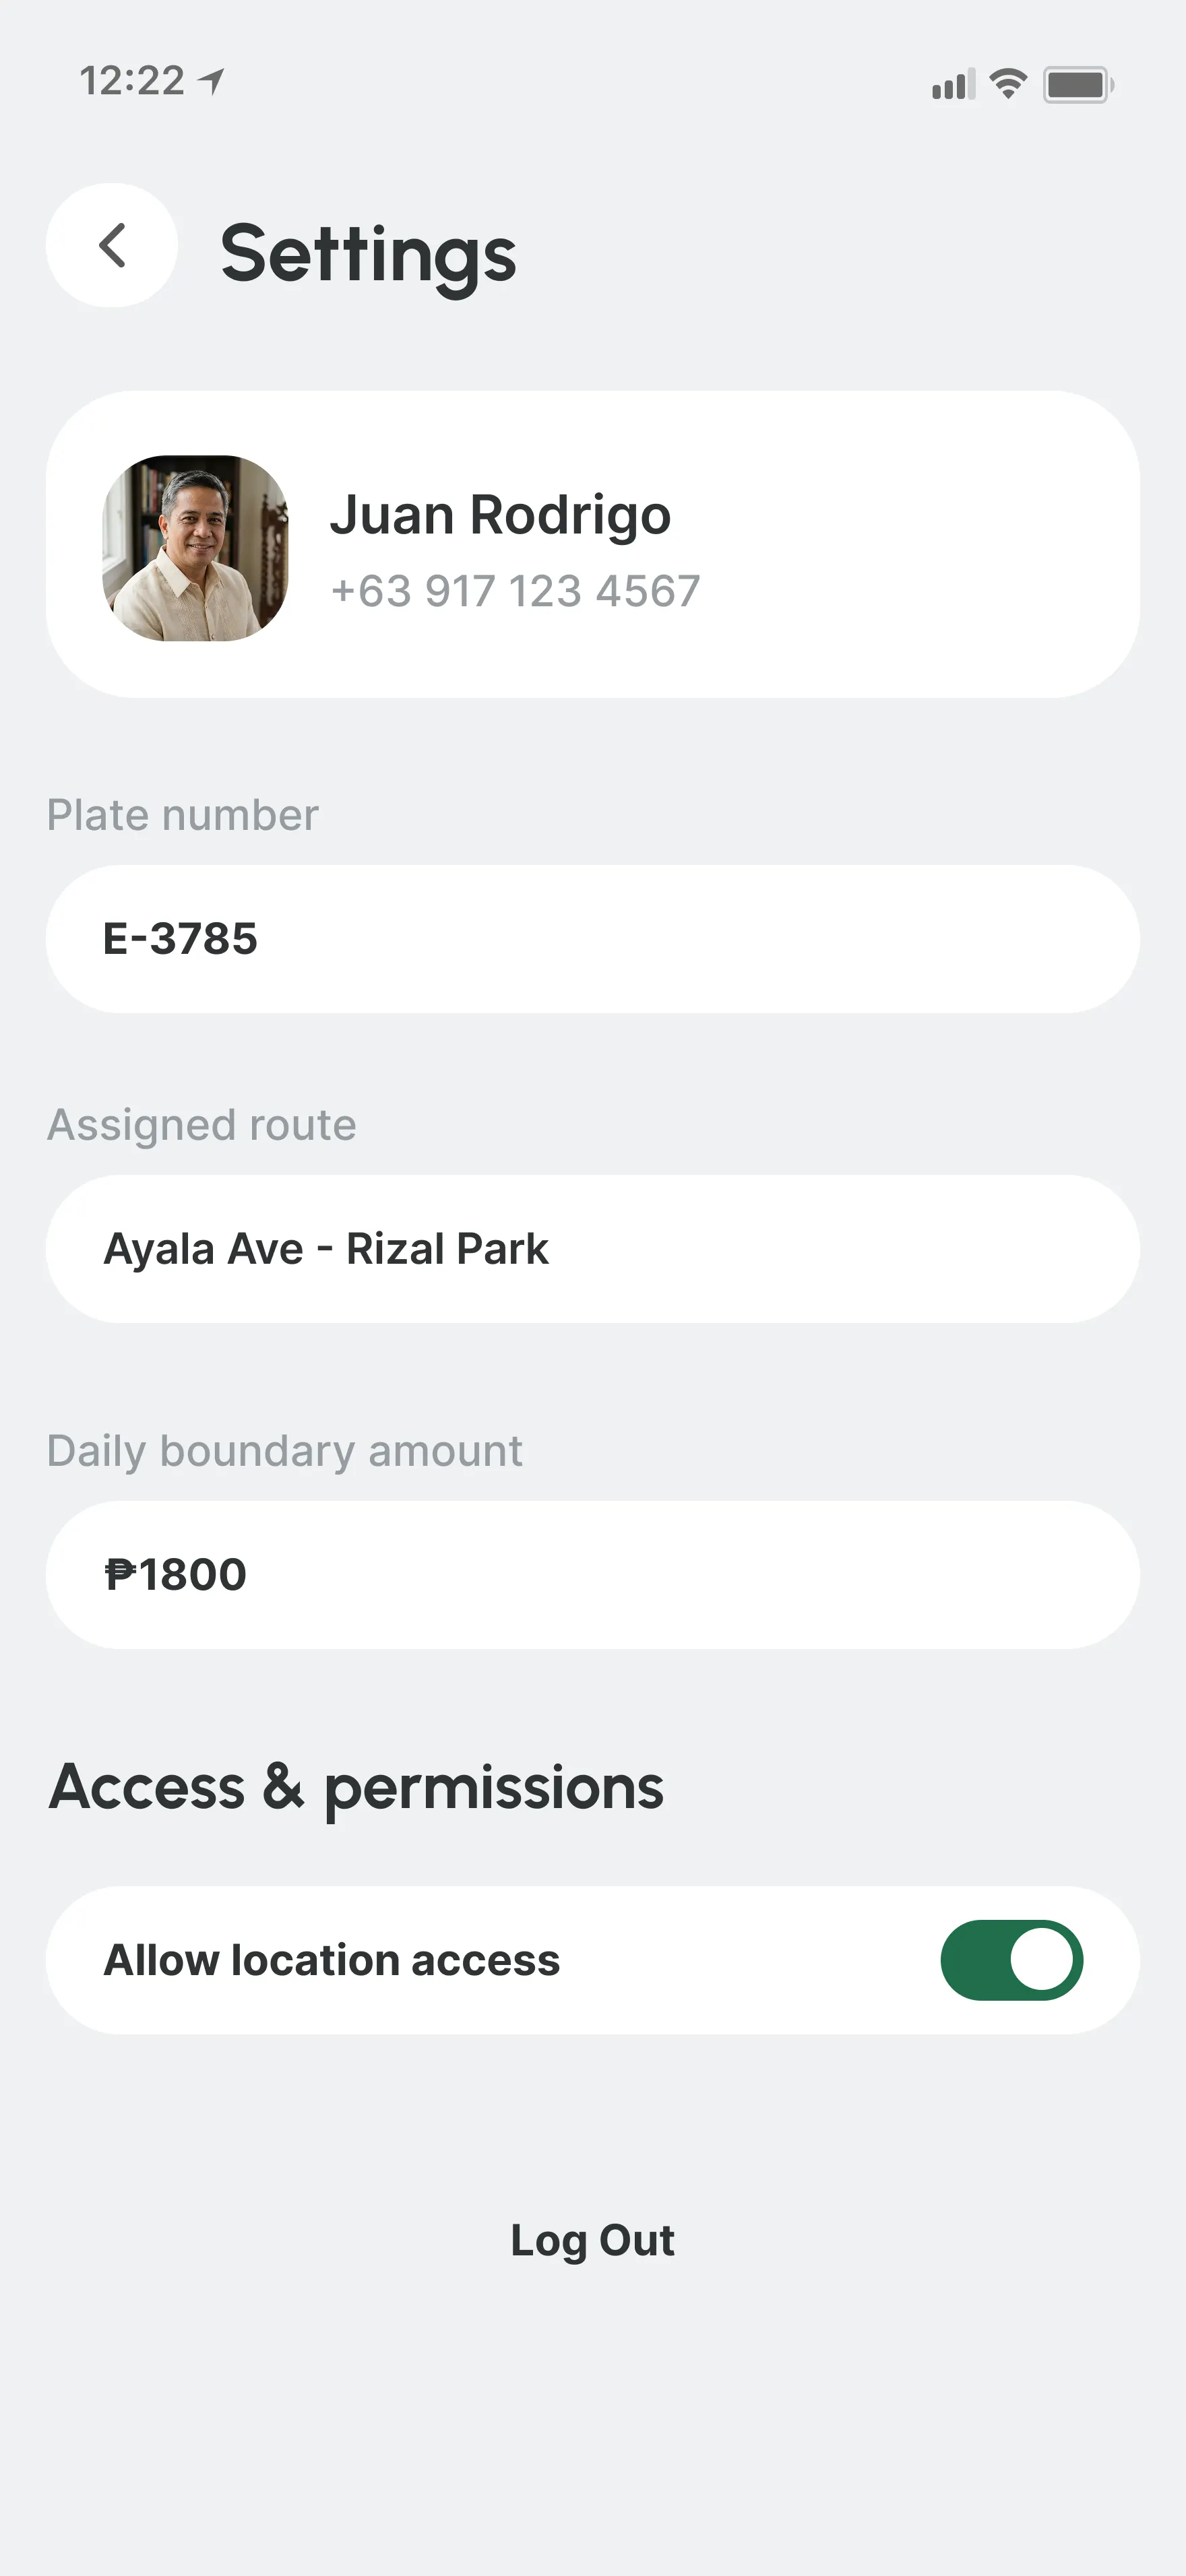
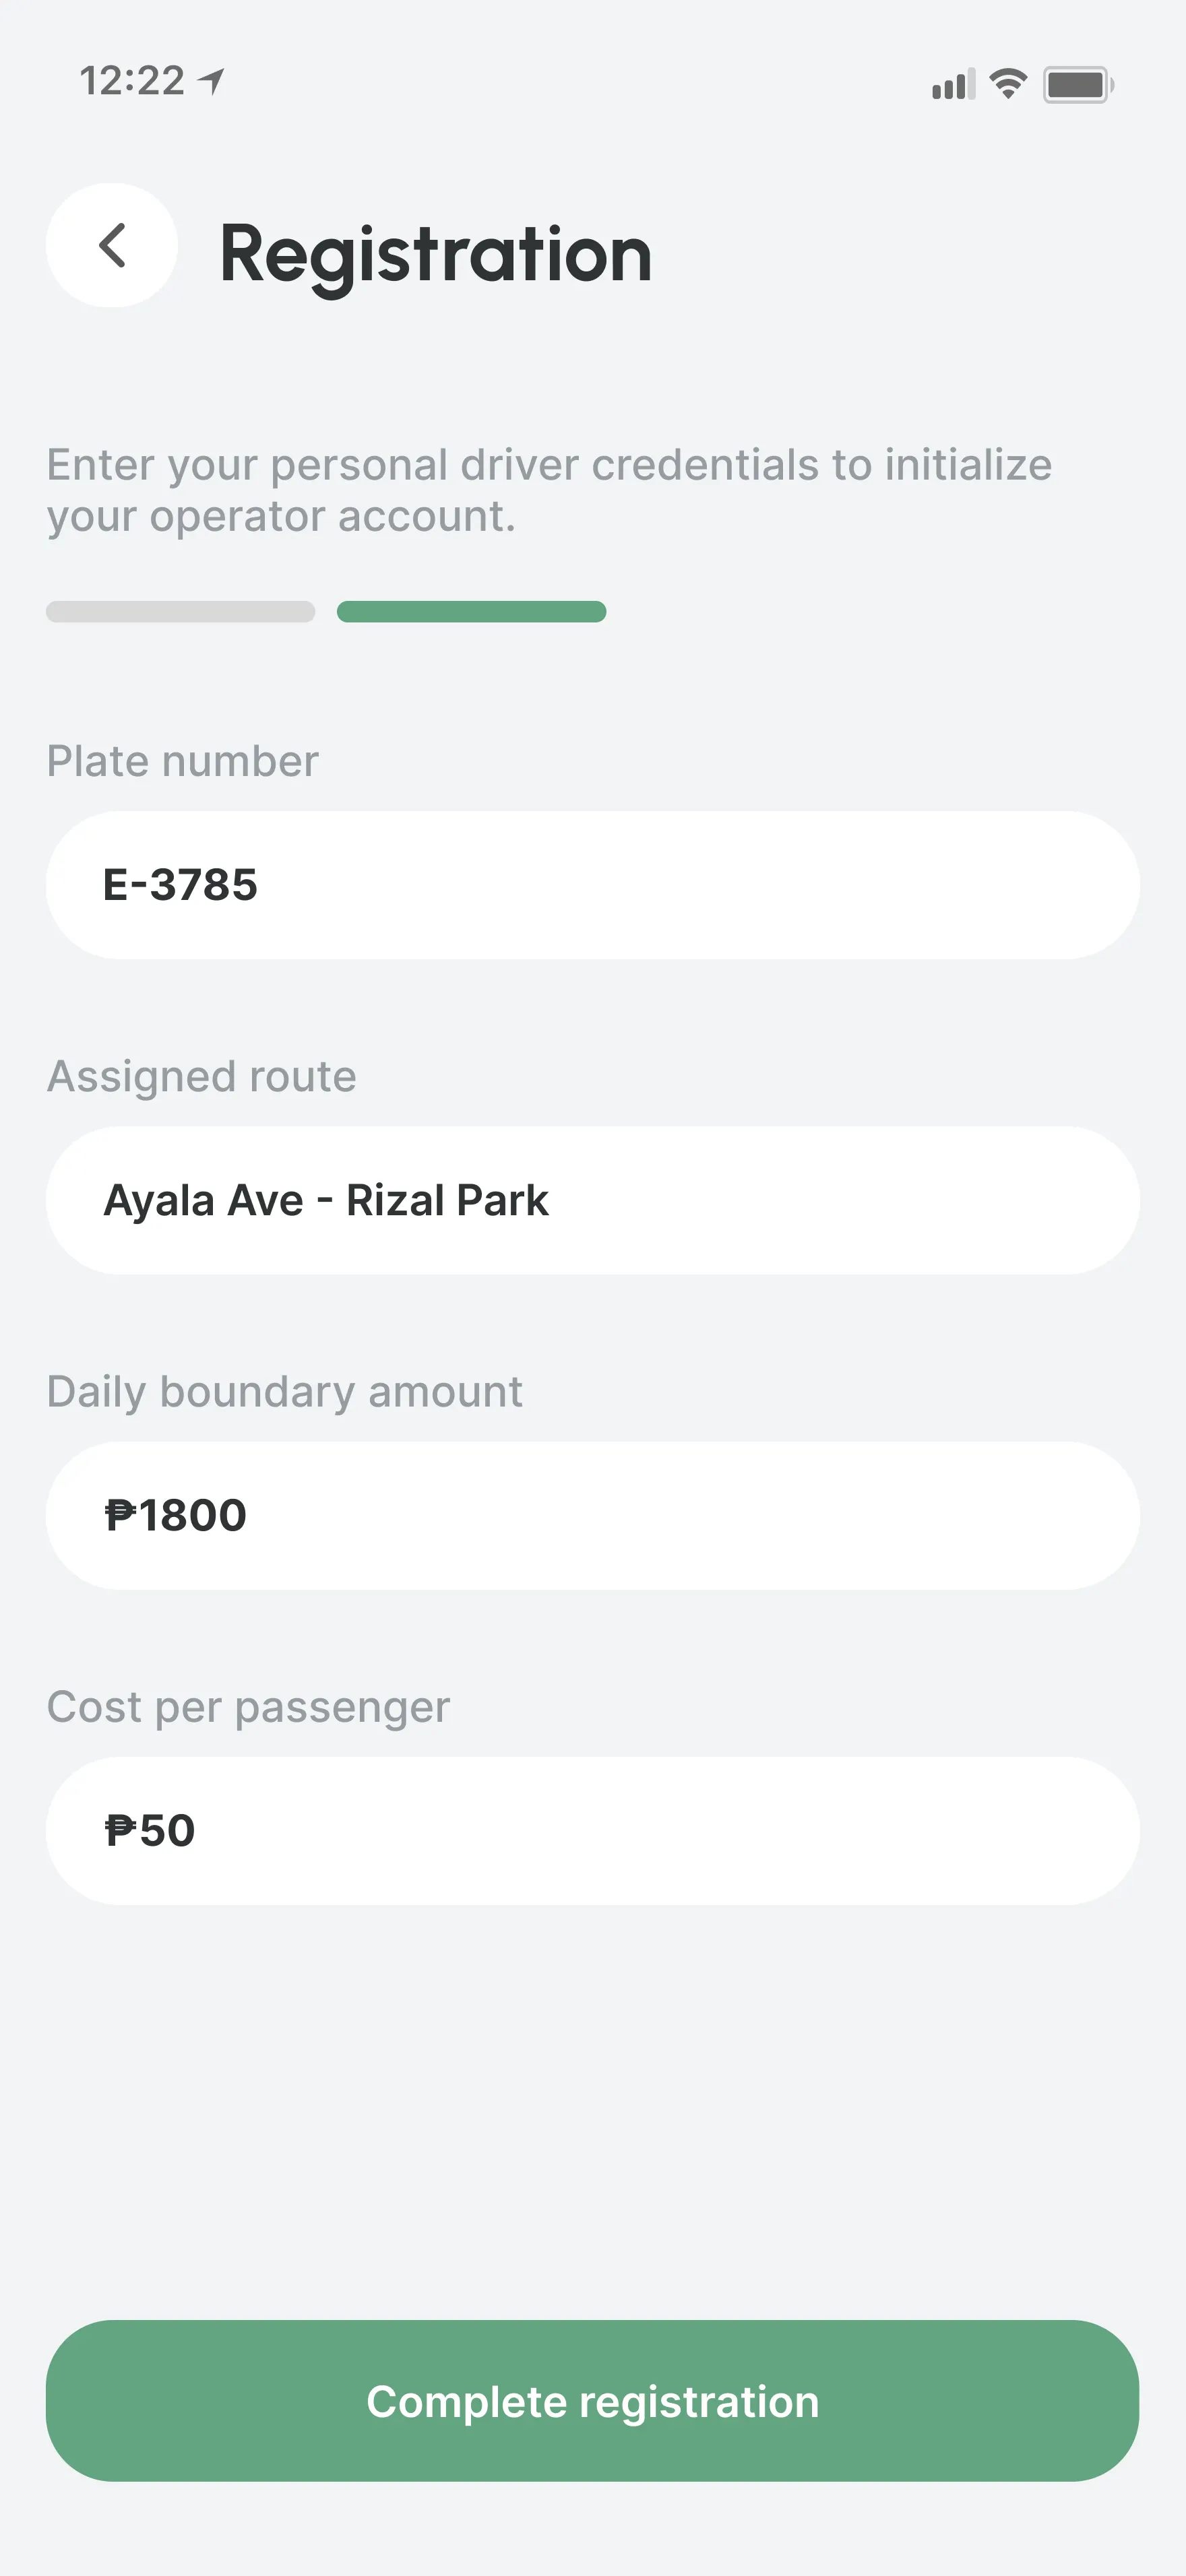
Driver & vehicle registration
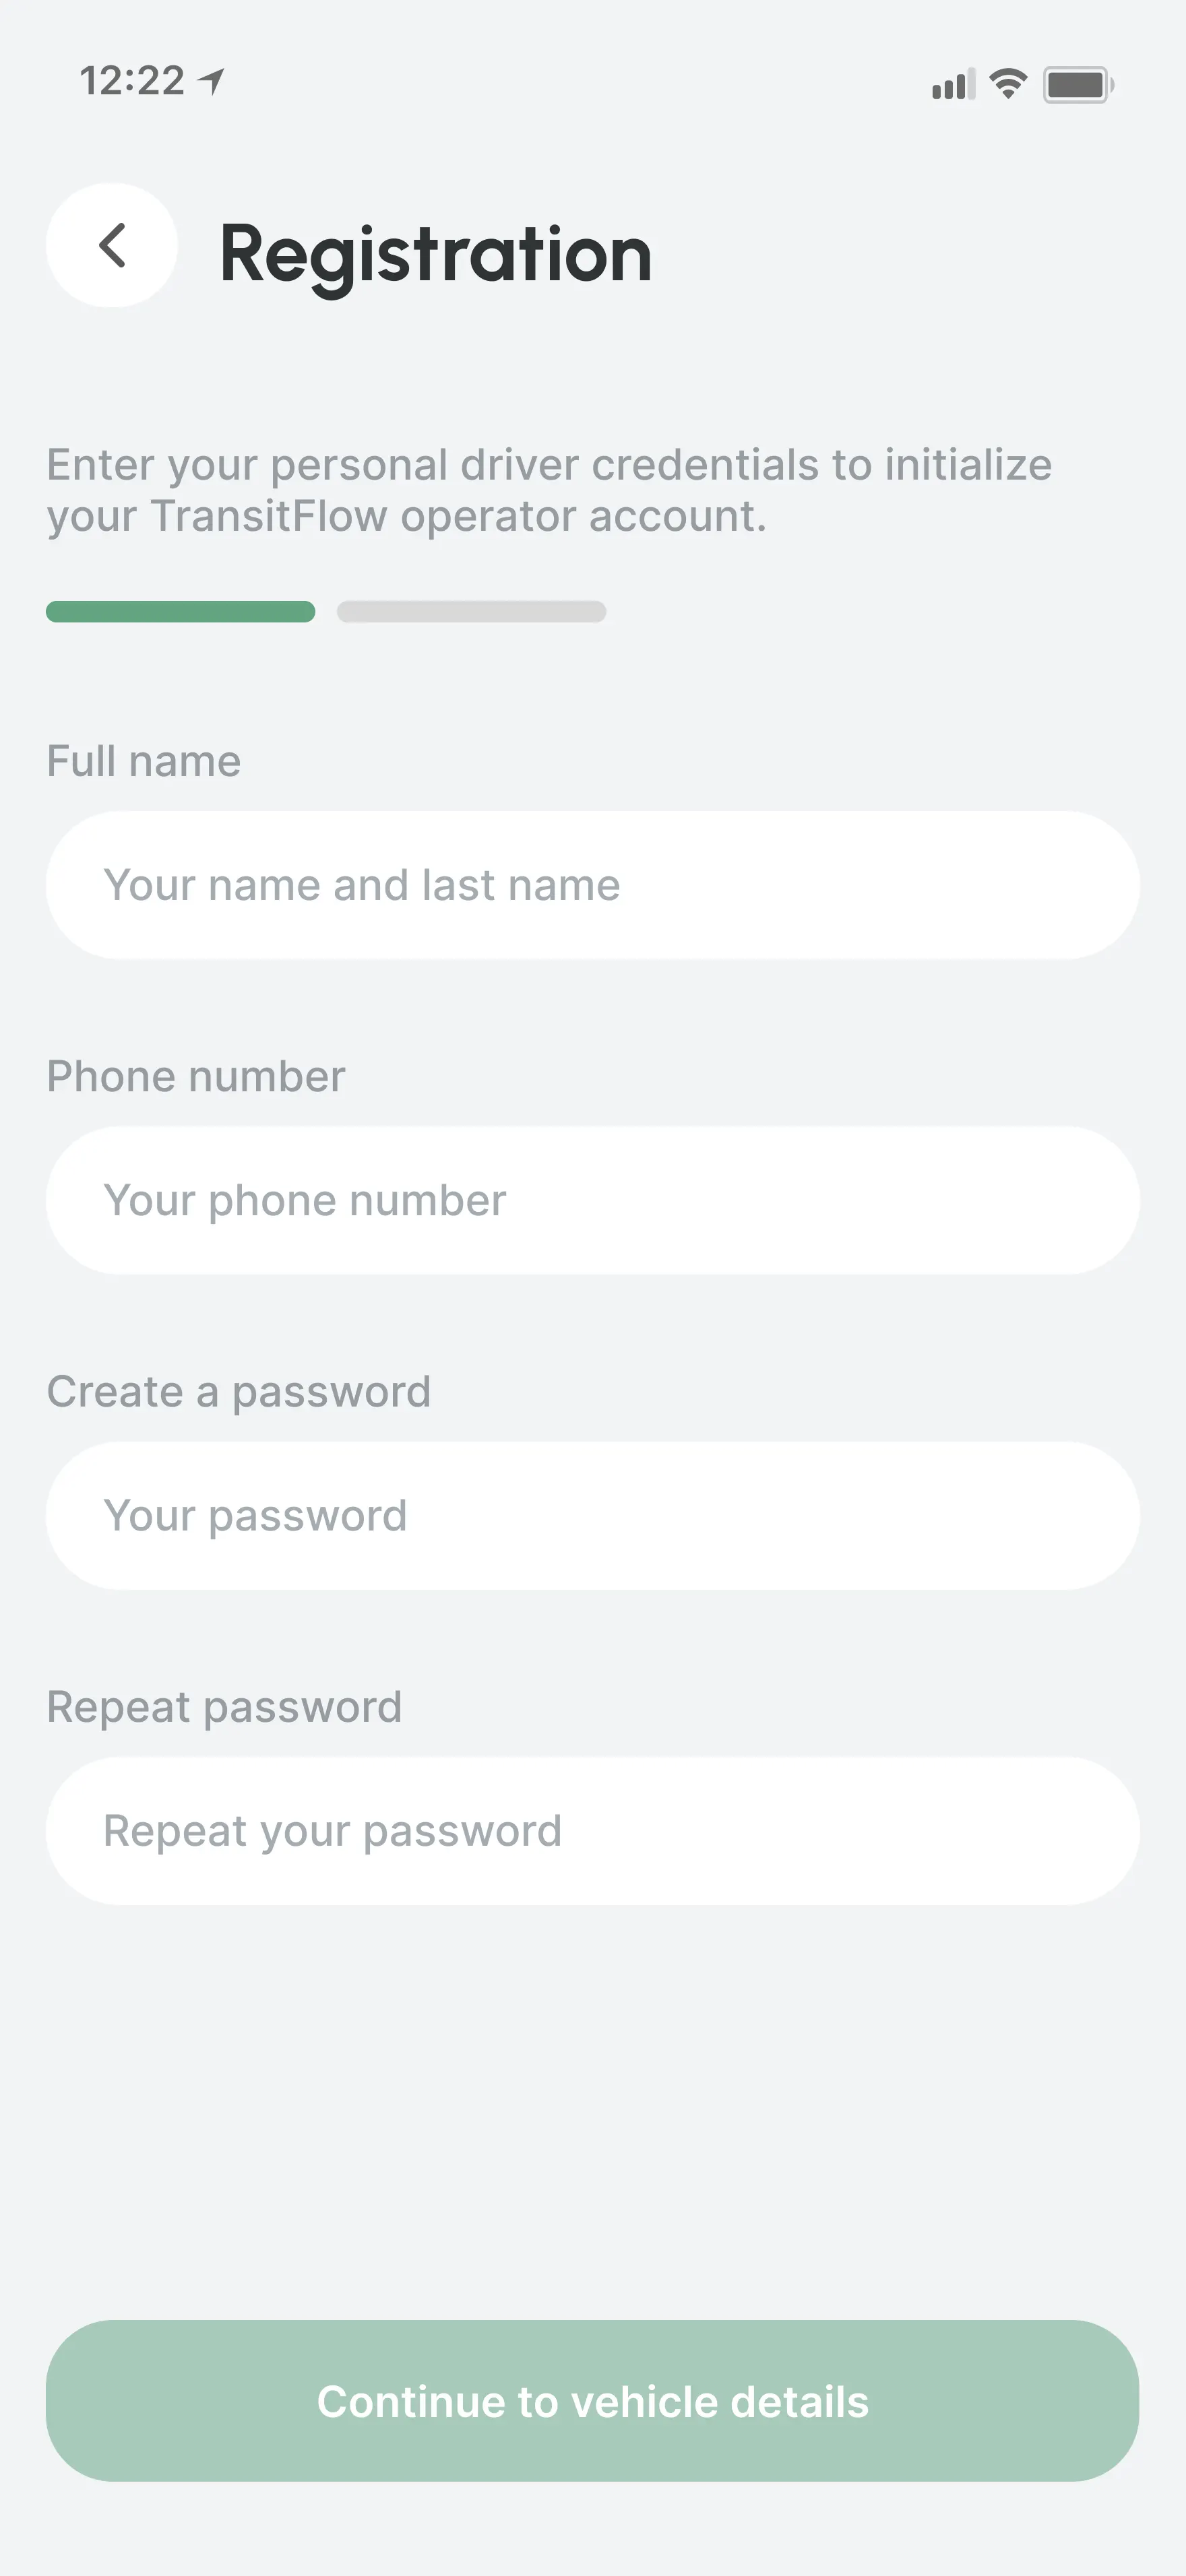
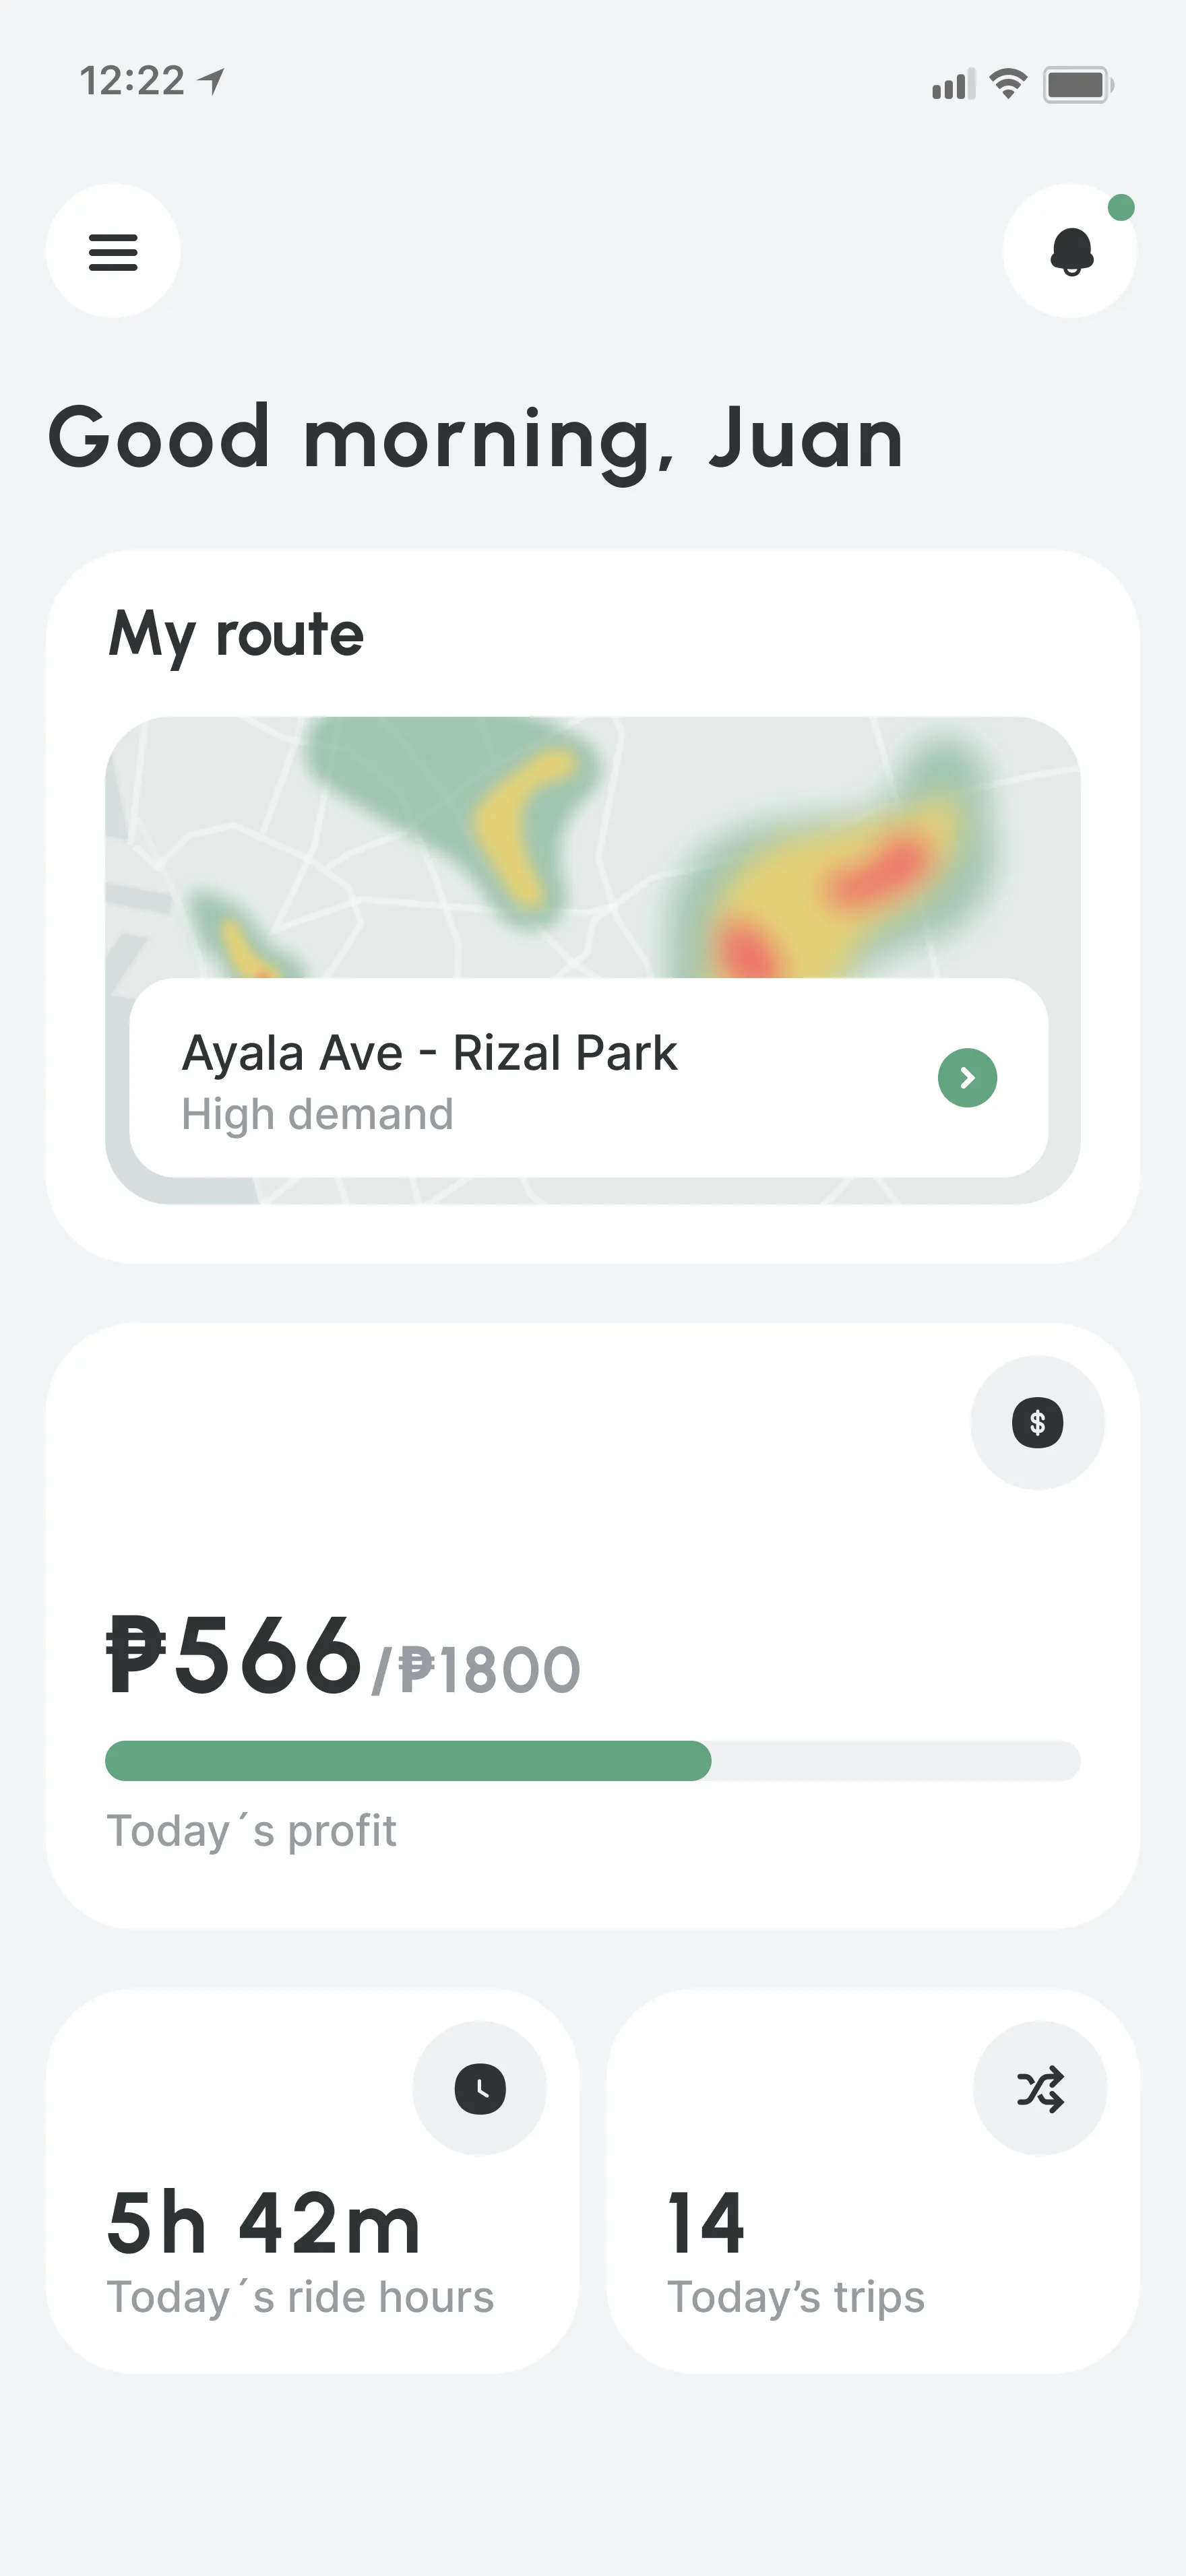
Dashboard
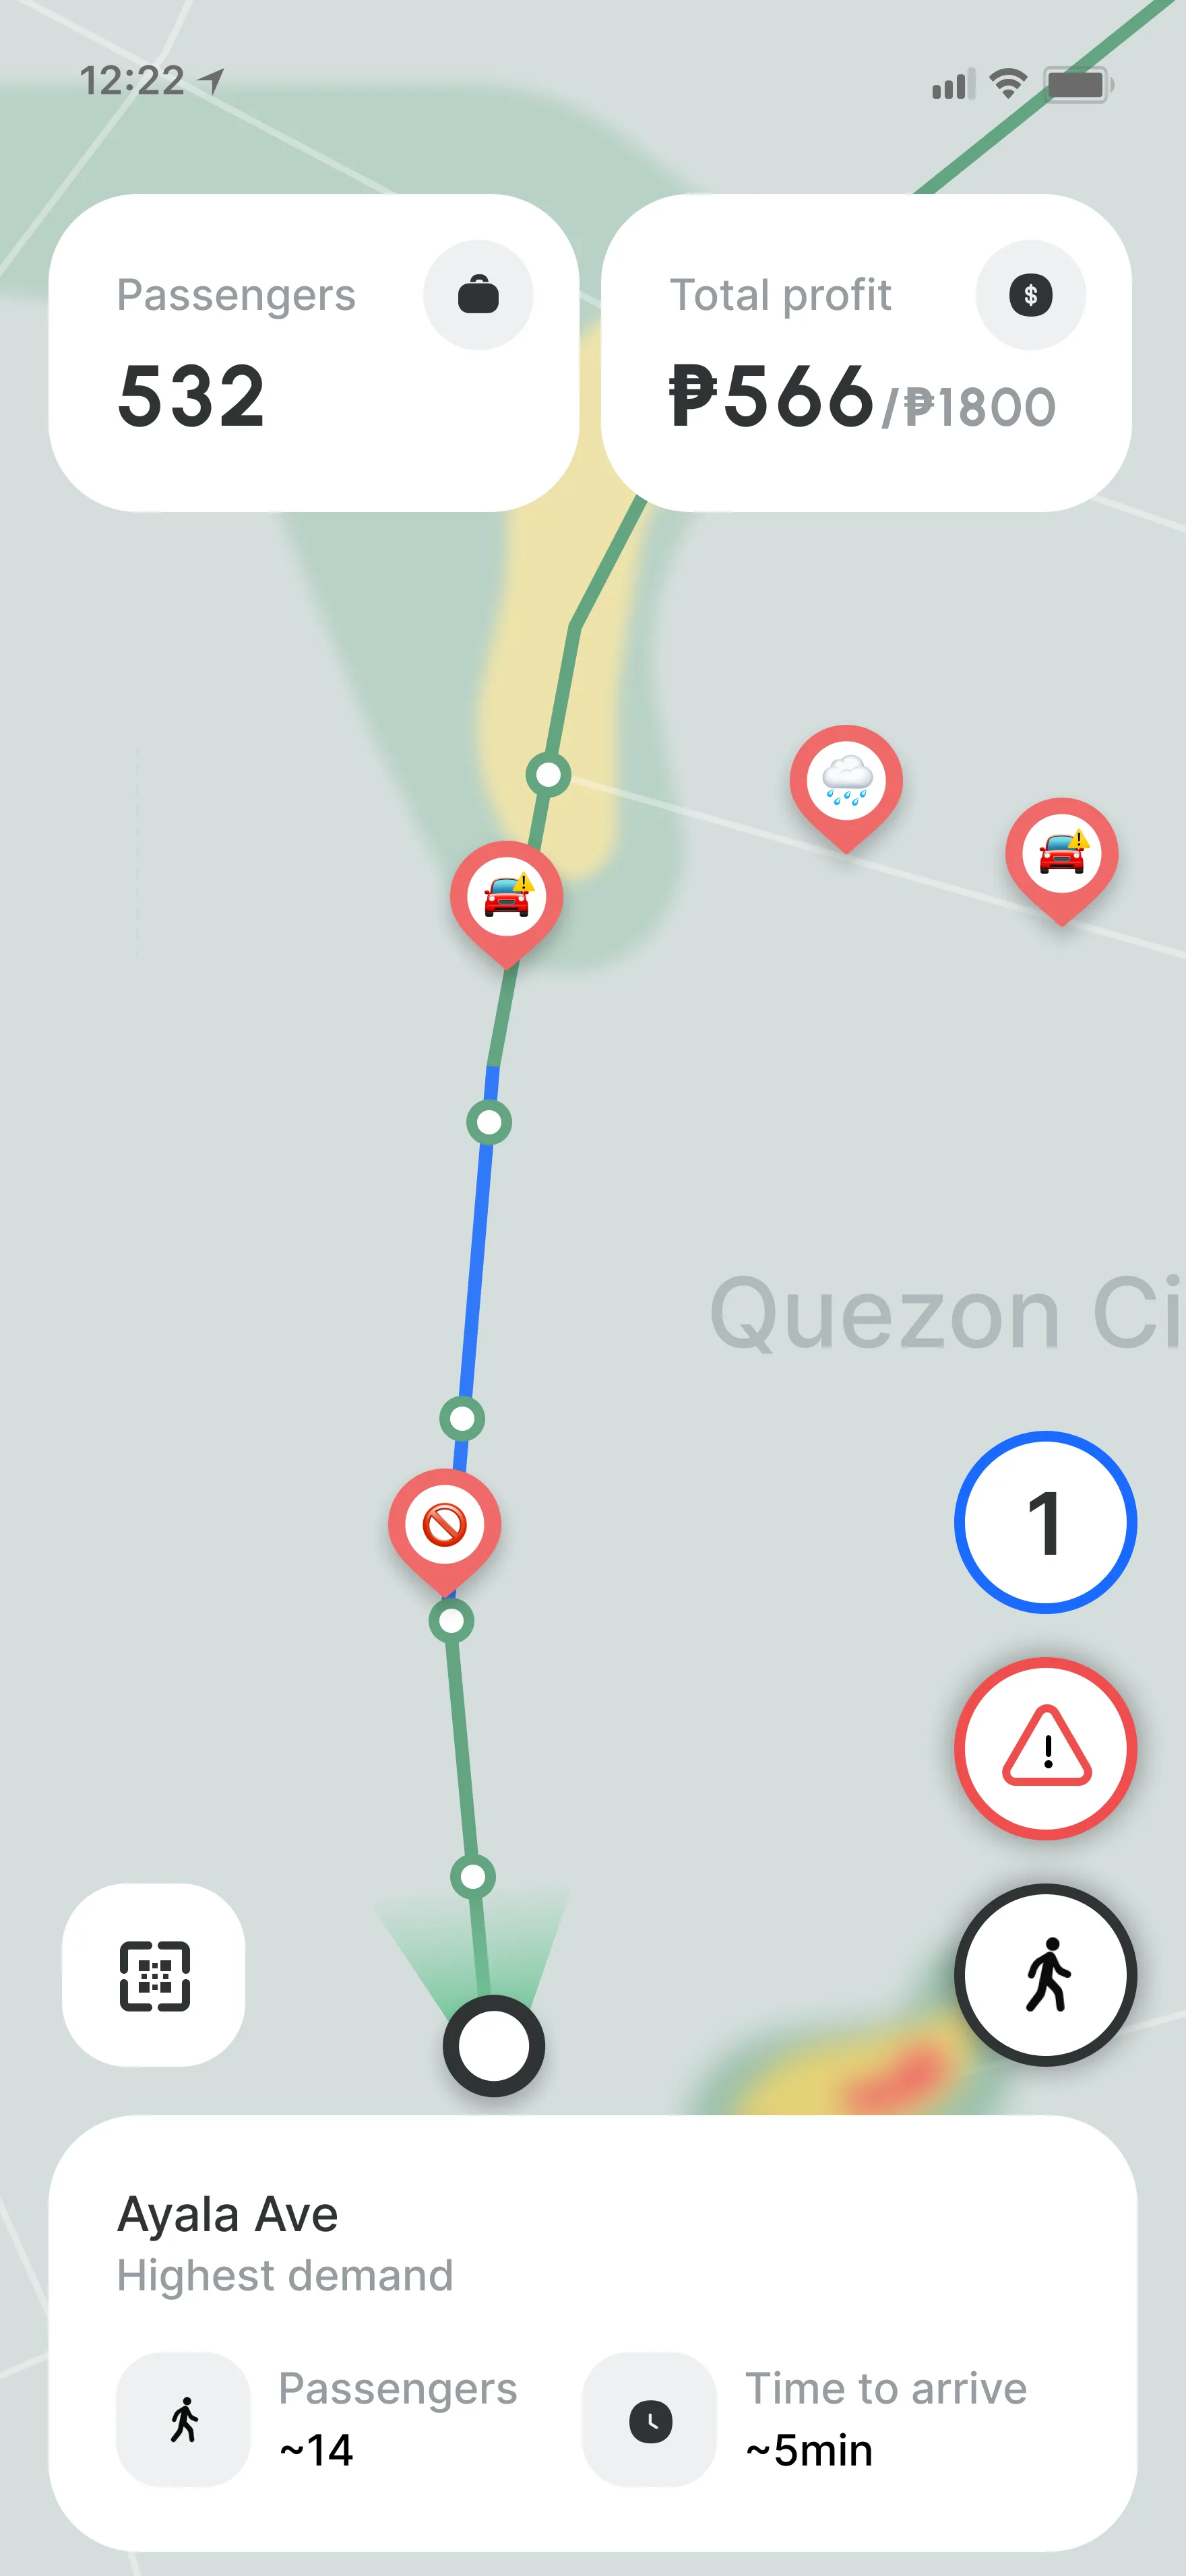
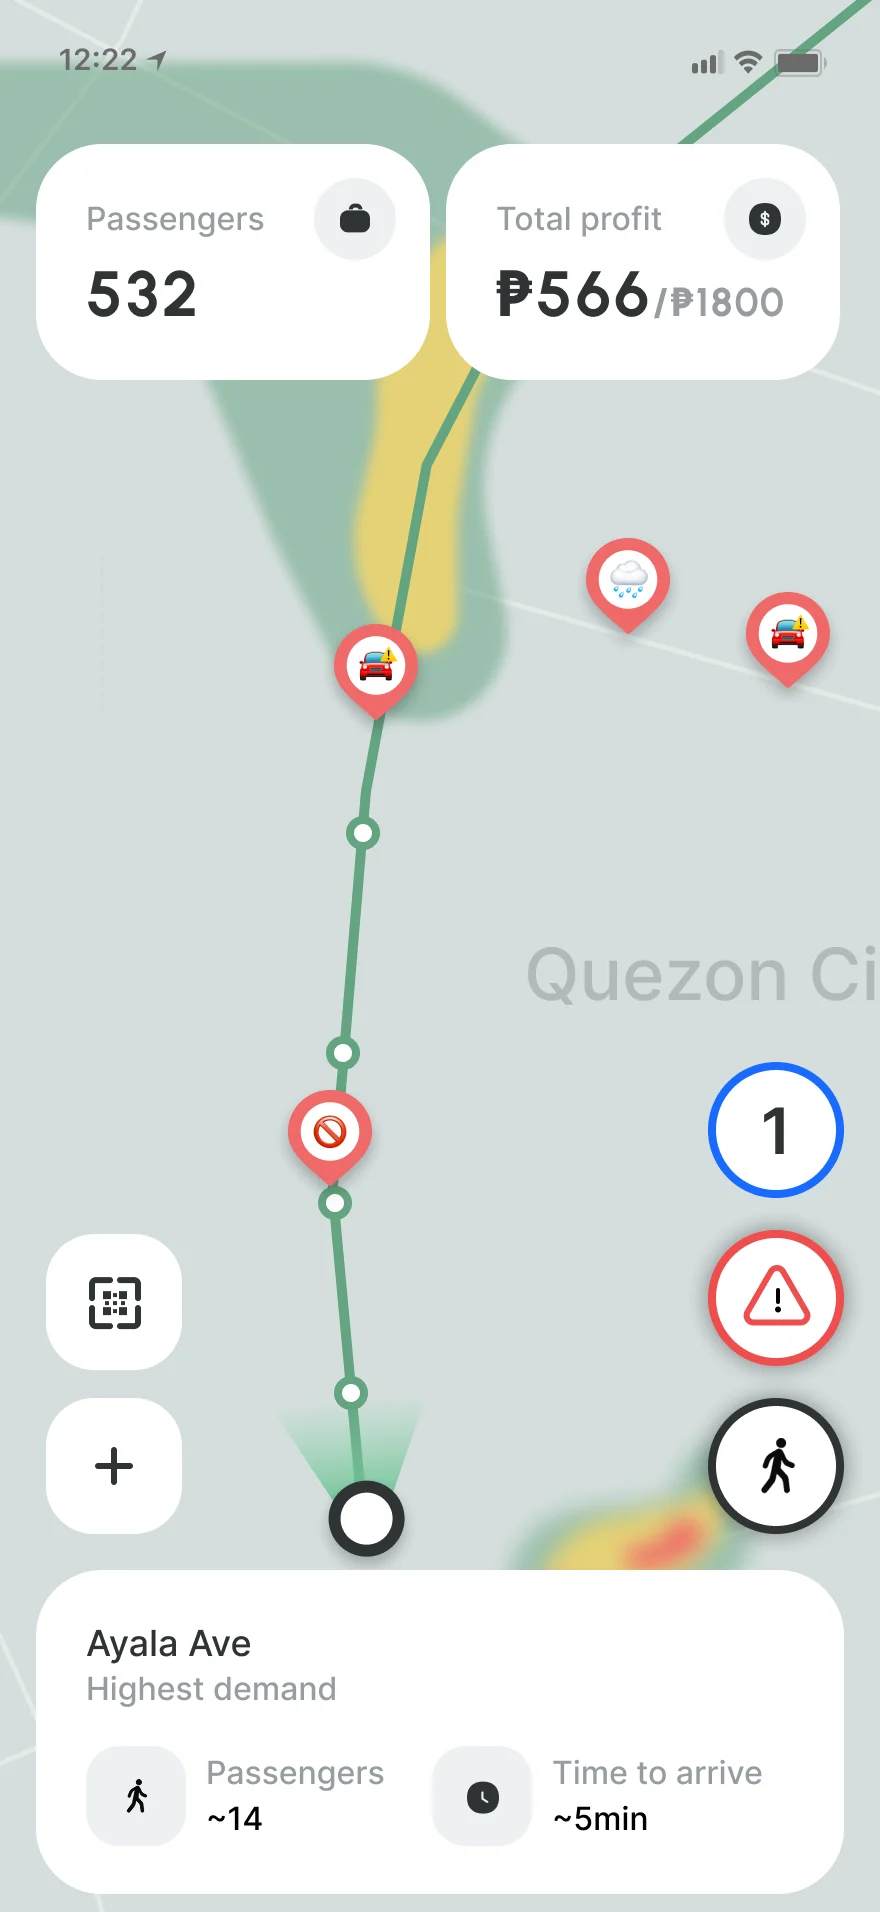
Route
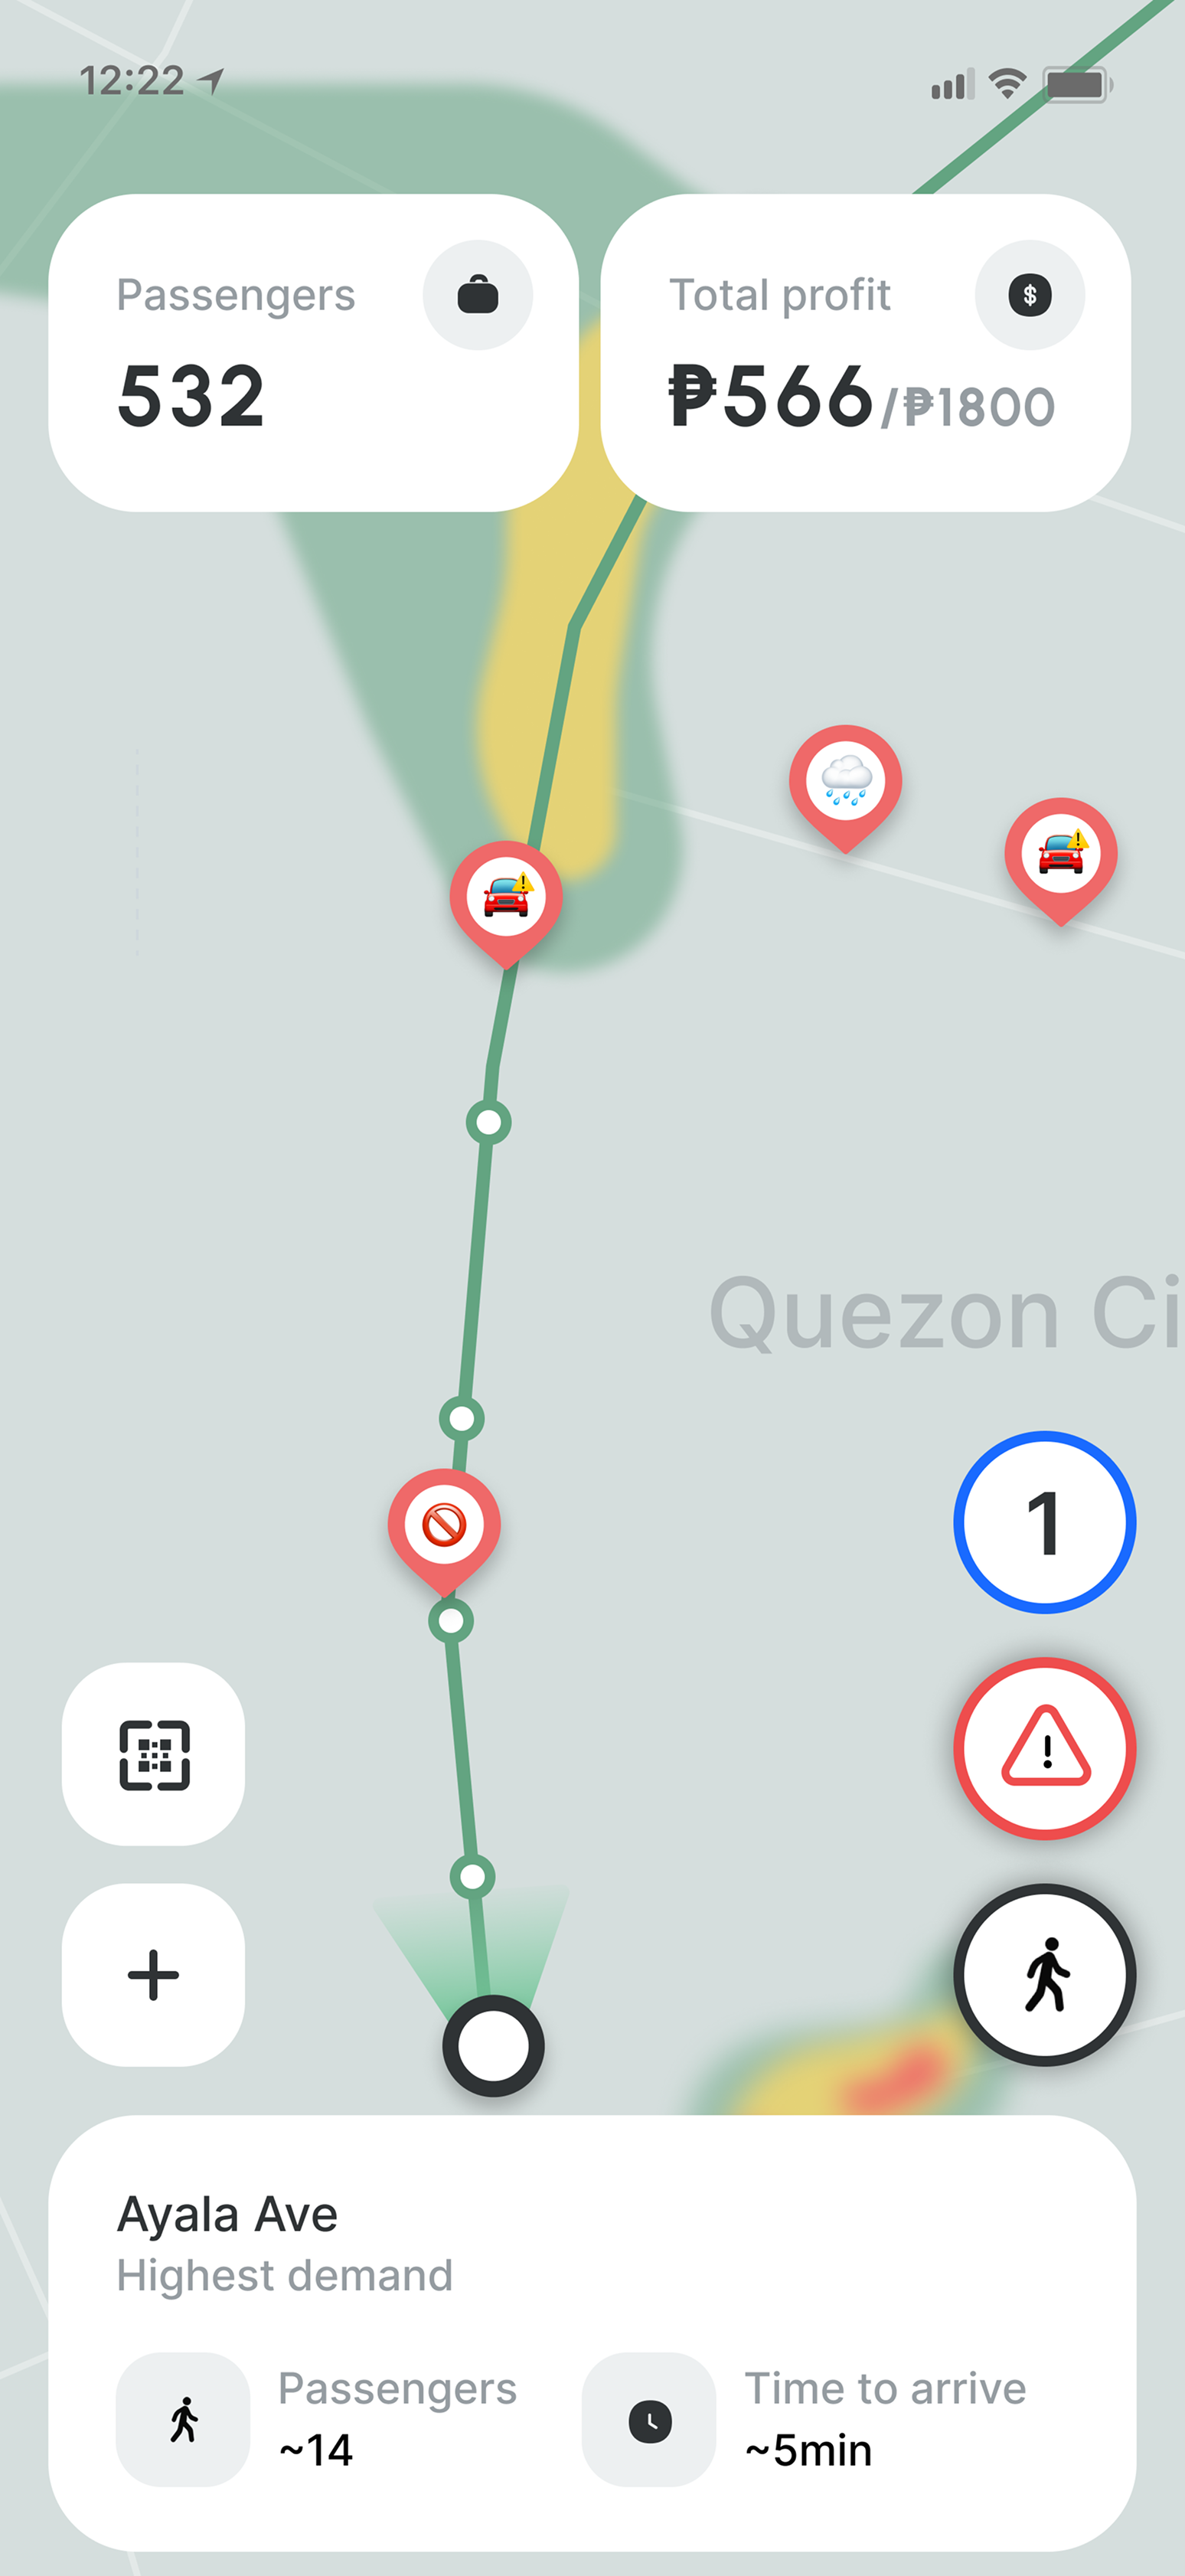
Showing approximate amount of passengers on every stop plus a heatmap based on historical info or by tracking users with the app installed.
Traffic and road events are shown like on the user side of the app.
Boundary live tracking works through payments, including scanning QR from the user-side app.
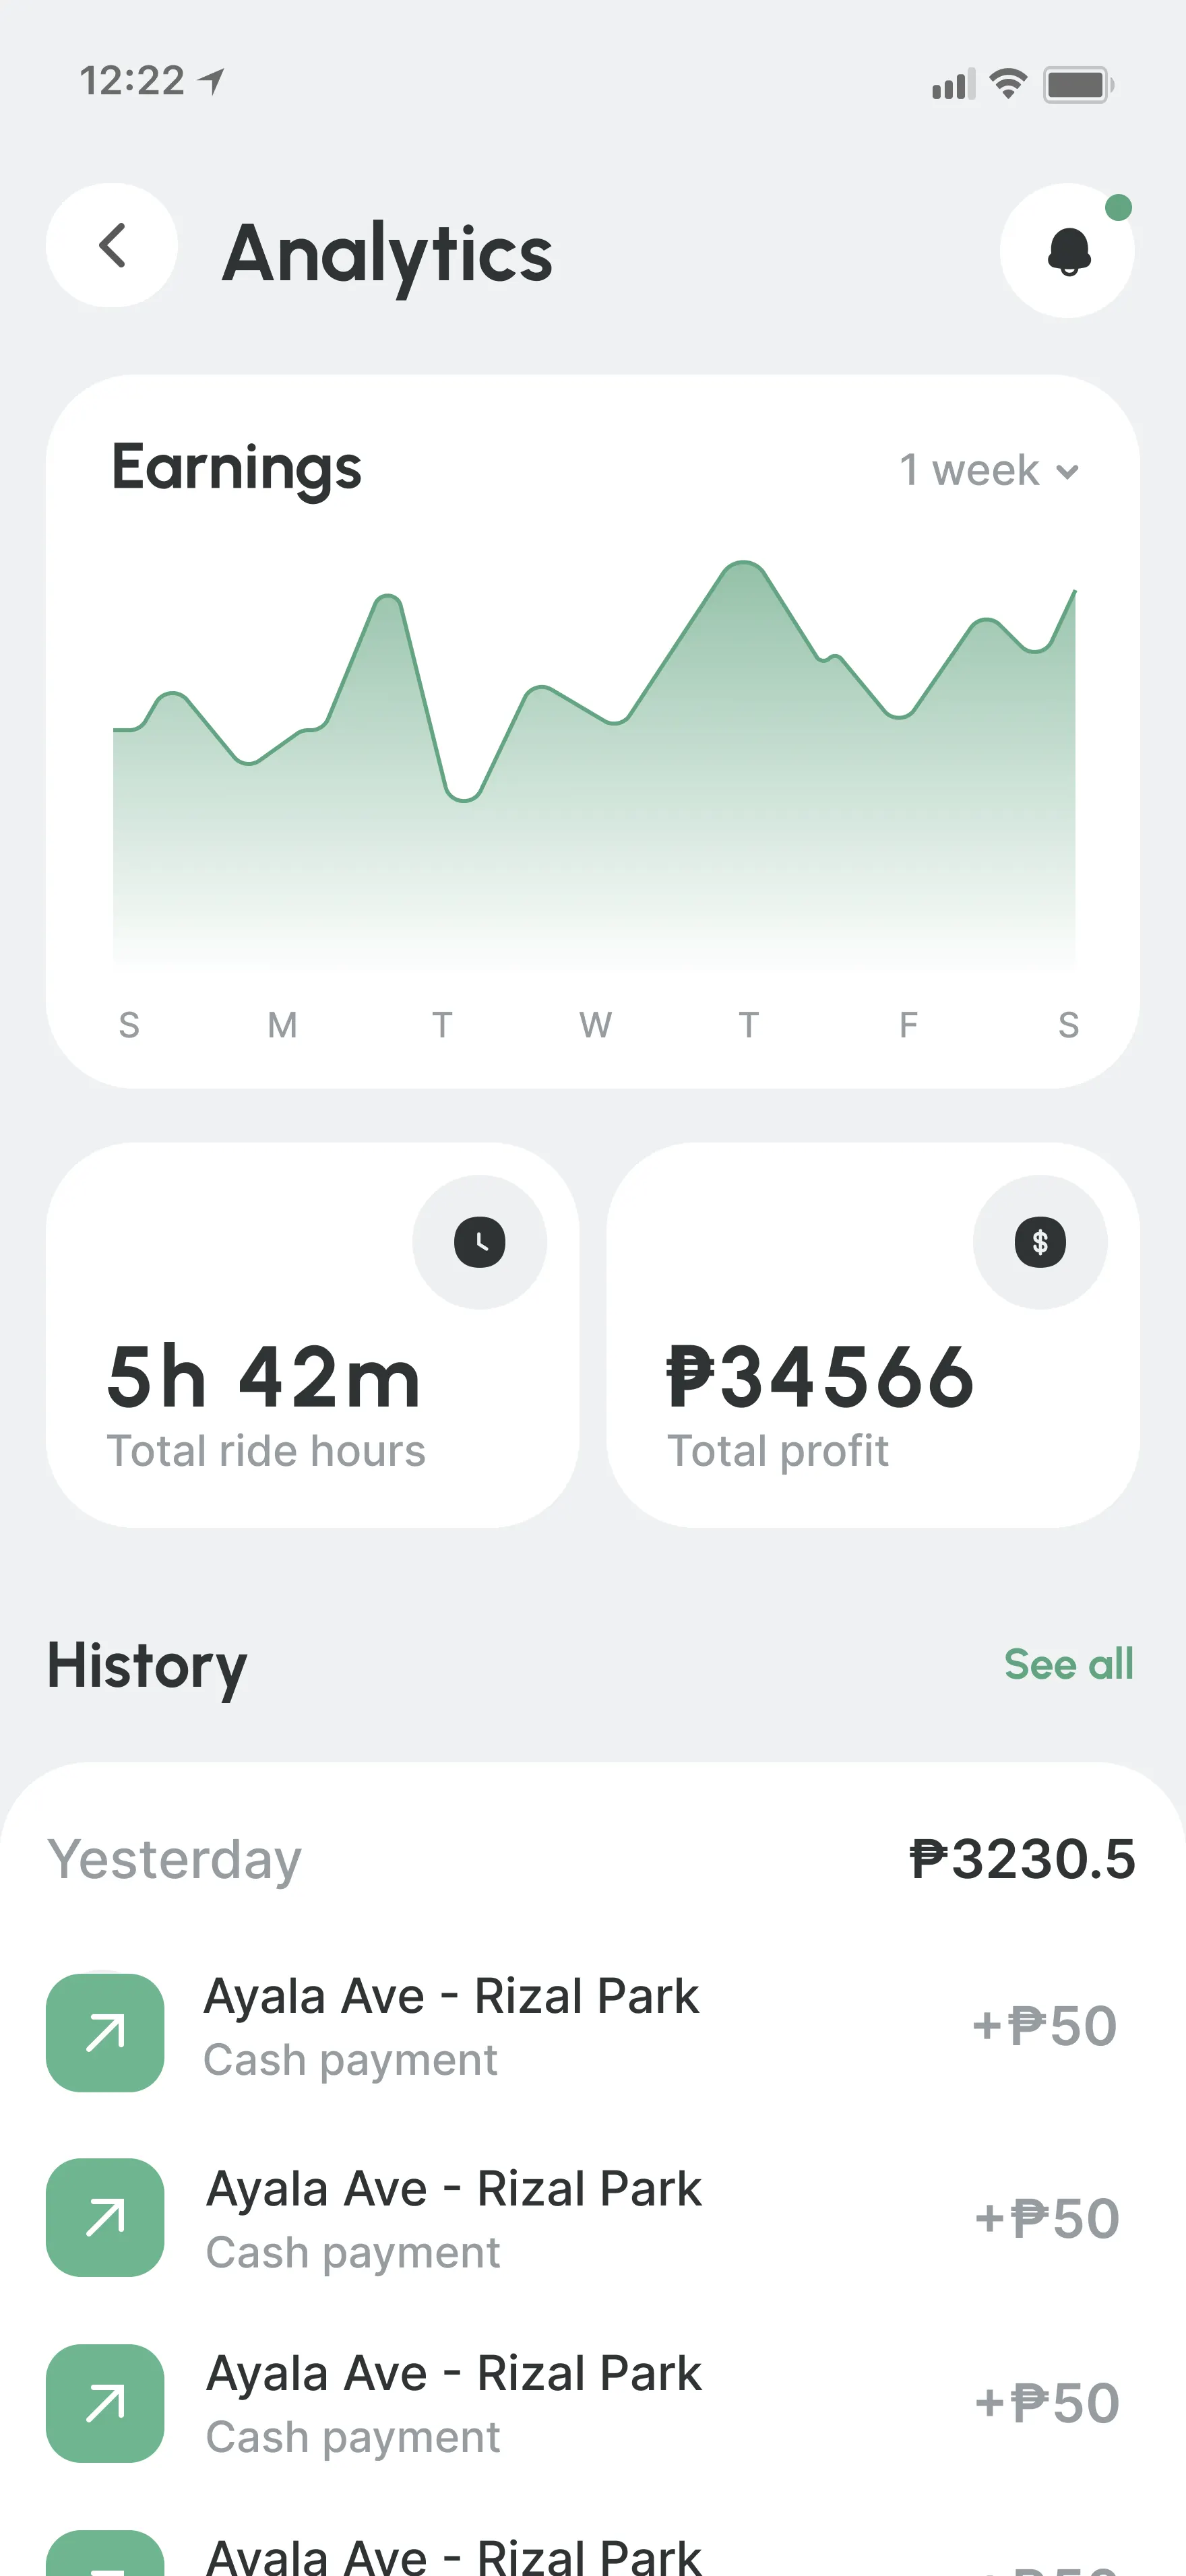
Analytics
Settings
Tradeoffs
Designing the driver-side experience meant accepting that the system could not promise perfect live demand. Only a minority of riders generate trackable real-time data, so the forecasts rely heavily on time-of-day patterns and become directionally useful rather than fully live. That tradeoff felt acceptable because even imperfect guidance is better than the total guesswork drivers operate with now.
Another tradeoff was choosing financial honesty over emotional comfort. Showing a driver exactly how far they are from boundary can feel uncomfortable in the moment, but hiding that number makes the cost of continuing invisible and leads to worse decisions. I also chose simplicity over depth. Richer analytics and comparison tools were intentionally cut because tech literacy constraints meant any critical action had to stay within two or three taps.
User testing
Observation: Although a commuter app was available, drivers explained that many passengers either did not use the app or preferred to pay in cash. As a result, drivers had no reliable way to track cash-paying passengers or reconcile their total earnings throughout the day.
This created a gap between digital and cash transactions, forcing drivers to estimate earnings manually or keep separate records outside the platform.
Drivers needed a fast and effortless way to record cash payments without disrupting their workflow or delaying passenger boarding.
Solution:Designed a lightweight cash-tracking feature that allows drivers to quickly add cash-paying passengers and automatically update their daily earnings summary. The interaction was optimized to require minimal input and could be completed within seconds, ensuring it fit naturally into the driver's workflow during busy shifts.
What remained unresolved
The biggest open question is how much confidence the product could build over time, not just in a first-use test. I validated that clearer routing, stop alerts, and more honest transport information made the experience easier to understand, but I did not test whether that would be strong enough to shift real commuting habits away from Grab over the long term.
The driver-side concept also remains only partially validated. The logic of demand guidance and earnings visibility tested well directionally, but it still depends on incomplete data, uneven driver adoption, and operating conditions that can change faster than the system can reliably reflect.
What this product does not solve
This product does not fix Manila's transport infrastructure. It does not create reliable GPS where none exists, standardize jeepney stops, remove traffic unpredictability, or solve the deeper operational issues that make the system hard to coordinate at city scale.
It also does not eliminate cash-based friction or guarantee perfect real-time accuracy. The goal of Tara is not to make the network flawless. It is to make an already functioning but opaque system more readable, less intimidating, and easier to trust.
If this shipped, what would need to happen
The first requirement would be a phased rollout with a narrow, realistic scope: a limited set of routes, clear data confidence labels, and commuter features that remain useful even when live information is incomplete. The product would need to be honest from day one about what is estimated, what is community-reported, and what is truly live.
For the driver-side system to work at all, adoption would need to come from both individual drivers and transport operators, supported by onboarding that respects low-tech workflows. Shipping this credibly would also require partnerships for route data, a lightweight reporting system for disruptions, and repeated field testing to understand whether the product improves decision-making in real conditions rather than only in prototype use.
What would I do differently?
I would research technical limitations and constraints more deeply before creating the prototype. The absence of fixed pricing was discovered by me only during user testing and was not stress-tested before.
What would I test next?
The use of the app was tested by users in the short term, but there is still a need to observe how the app affects habits and decision-making in the long term.
What did this teach me about UX?
User control and openness to try something new can reinforce each other: giving users options can motivate them to make choices they usually would not make.
Giving useful information is more important than giving precise information.
Final Thoughts
1. Confidence is a design problem, not an infrastructure problem. The jeepney system is not broken. It is opaque. Before redesigning systems, the better question is whether existing systems can be made more readable.
2. User control and openness reinforce each other. Giving users the ability to filter transport modes upfront did not reduce their willingness to try jeepneys - it increased it. When users felt they had agency, they became more curious, not less.
3. One bad experience can end trust permanently. Stefan missed one stop and gave up on jeepneys for the rest of his trip. The GPS stop alert mattered not because of frequency of use, but because its absence caused irreversible damage to confidence.
4. Useful information beats precise information. A historical wait estimate labeled approximately four minutes is more useful than silence. A plain-language safety label is more useful than a numeric score nobody can interpret.
5. The assumptions that feel most obvious are often the ones that need testing first. Showing all routes upfront, using a numeric safety score, and assuming digital payment could be unified across modes all felt reasonable before testing. The research that surprised me most shaped the design most.
6. Next steps would include exploring long-term behavioral tracking to understand whether the app actually shifts commuters away from Grab over time. A rewards system for reporting delays and disruptions could also build better community-sourced data and reduce reliance on historical patterns alone.
Appendix
Manila's public transport problem is local, but the underlying problem is universal: systems designed by insiders are often illegible to outsiders. Immigrants struggle with bureaucracy. Tourists get lost. New employees cannot navigate company culture. Patients do not understand healthcare navigation.
The app demonstrates that before we redesign systems from scratch, we should ask whether we can make existing systems more readable.
Often, the system is not broken. It is just undocumented, built on local knowledge and unwritten conventions. Design's job is to externalize that knowledge so newcomers can participate without having to be insiders first.
This is why the project's real value is not the app itself. It is the proof that confidence is a design problem, not an infrastructure problem. When users understand how something works, they stop avoiding it. When they feel they have agency, they explore it. When systems are honest about constraints, they become trustworthy.

Get in touch
Have a project in mind or just want to chat? Drop me an email.
How to Find Me
Email Me